
- EdTech
- Data dashboard
From fragmented reports to district-wide clarity
Redesigned Nearpod Reports to give school and district leaders a trustworthy, self-serve view of adoption and instructional use—from organization-wide trends to individual educator activity.
- Year
- 2023–2024
- Industry
- EdTech
- Company
- Renaissance
- Role
- Product Designer
- Capabilities
- Product design, Data visualization, Usability research
Problem
Nearpod captured how educators and students used lessons and activities, but school and district leaders lacked a dependable way to understand that engagement across their organizations. Reports were fragmented, and inconsistent underlying data made it difficult to compare usage across schools or identify where adoption was growing—or stalling. Administrators often relied on Nearpod representatives or their own surveys to piece together the story.
That gap mattered beyond reporting. Leaders needed credible evidence to plan support for educators, demonstrate the value of their investment, and make renewal decisions. The challenge was to turn complex usage data into a trustworthy, self-serve view without overwhelming administrators with every available metric.
Solution
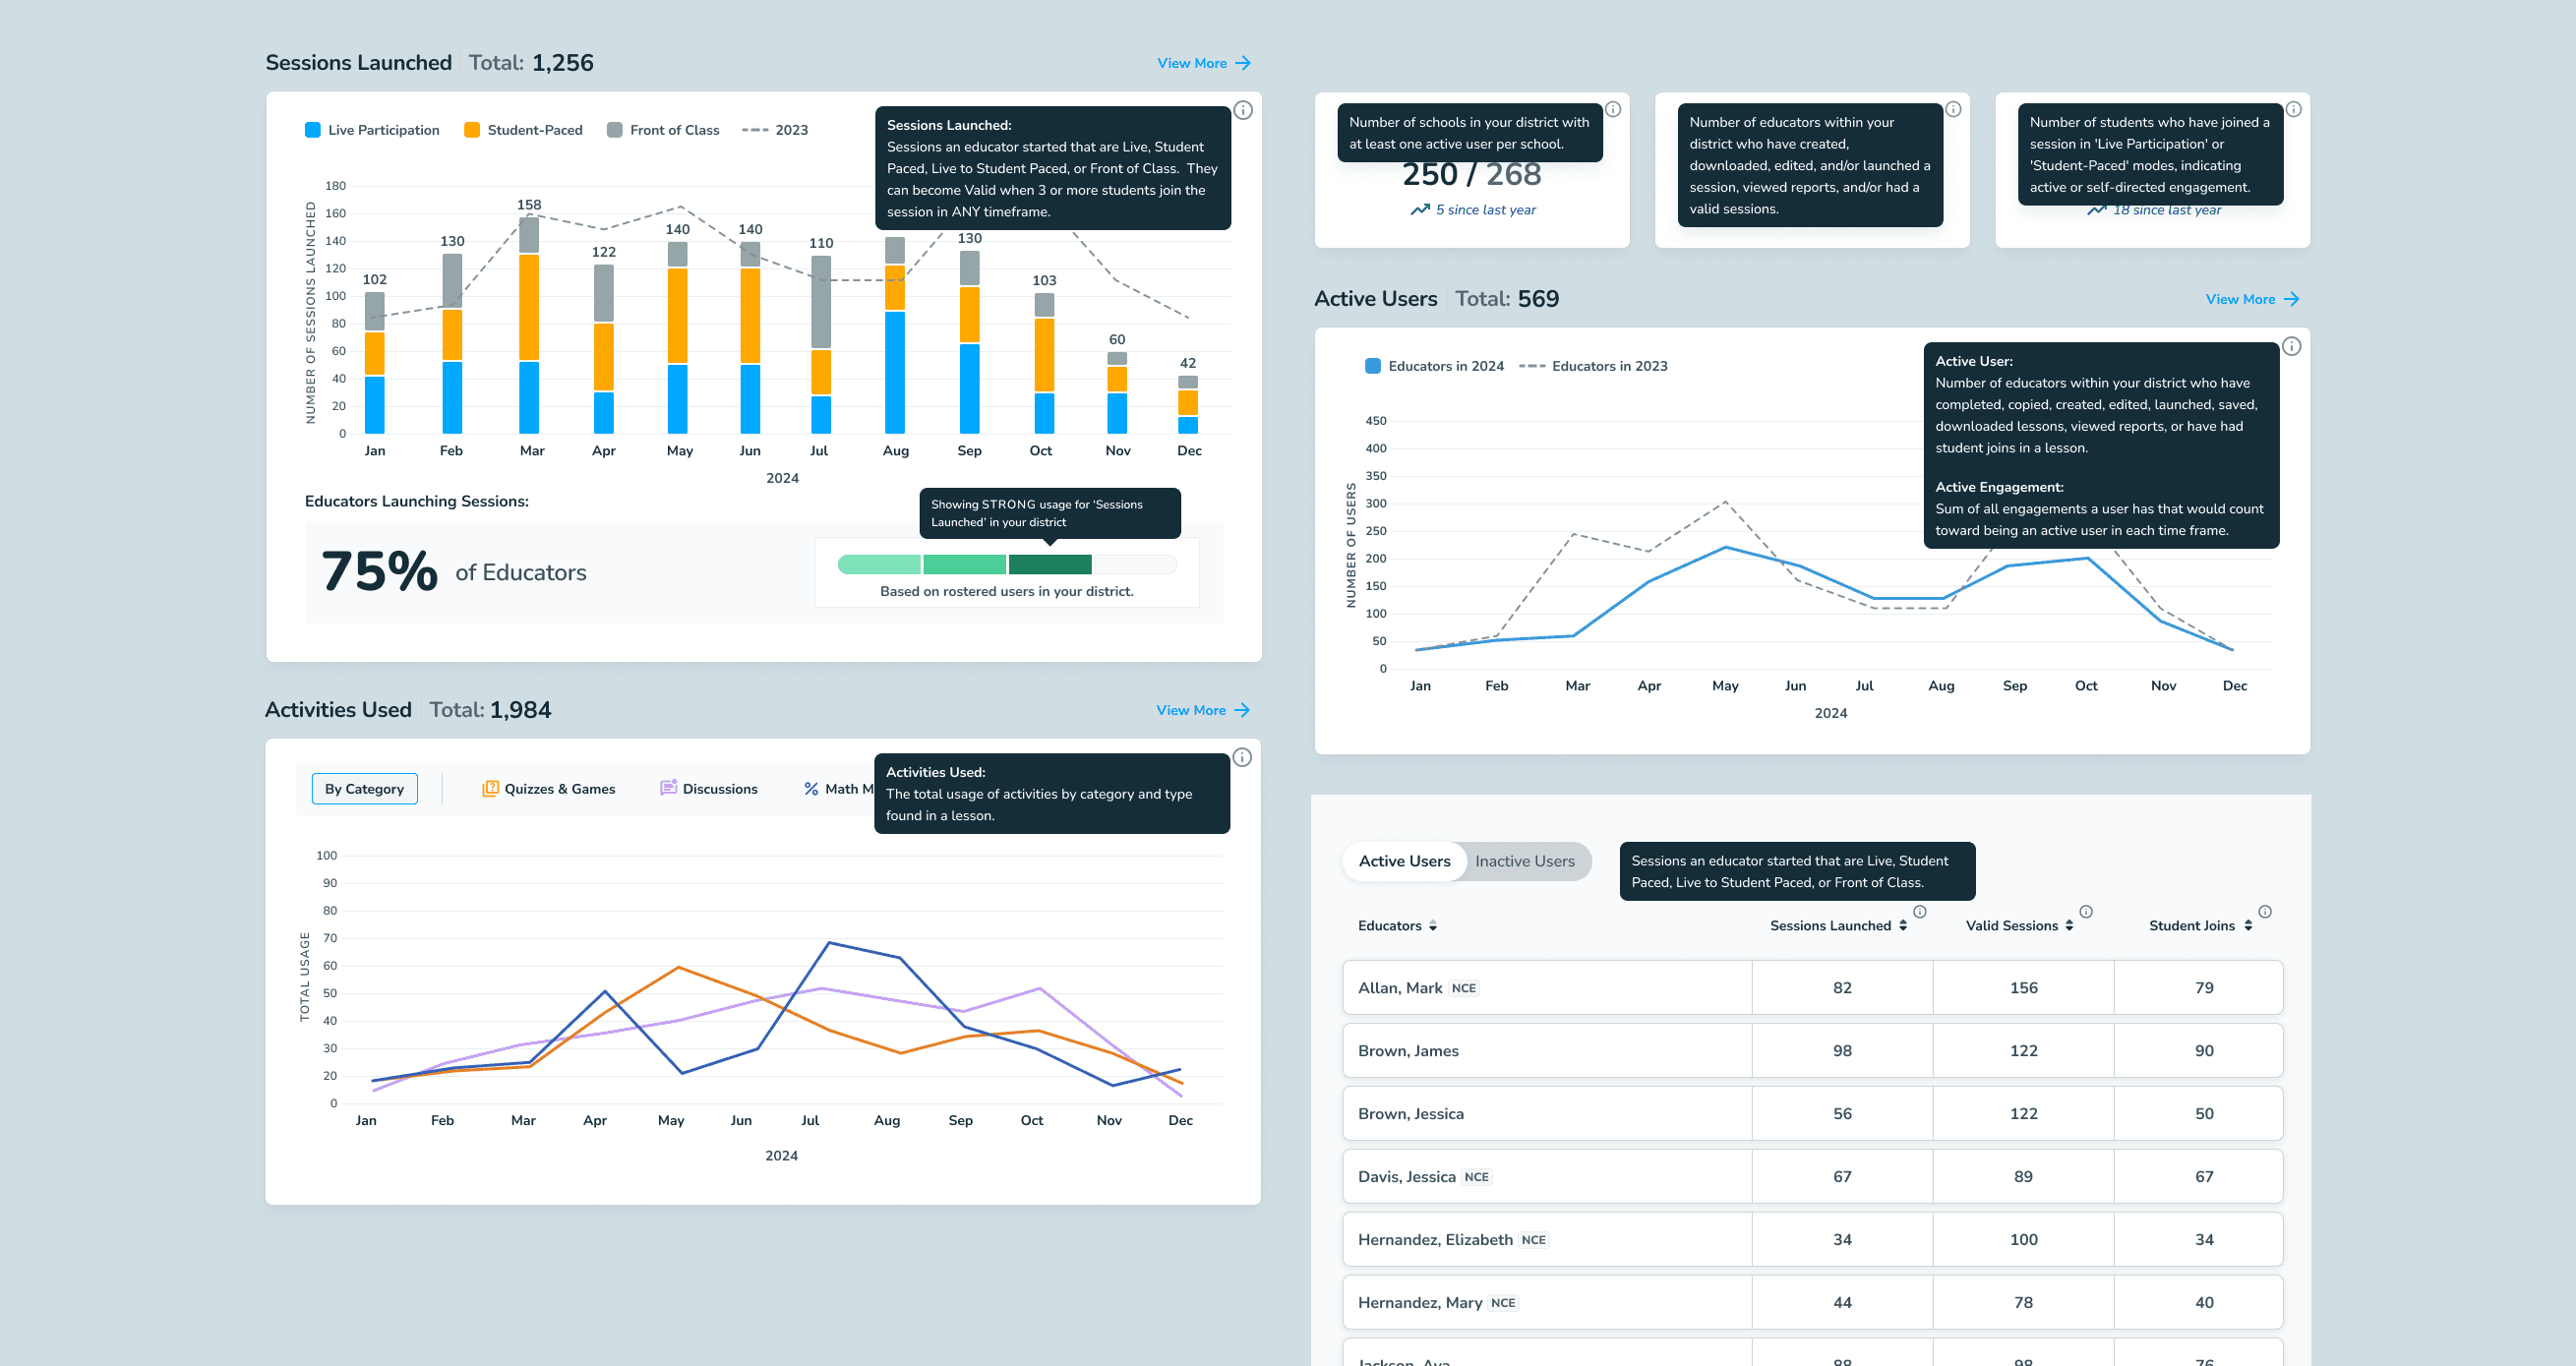
I redesigned Nearpod Reports as a self-serve view of adoption and instructional use. Working with product and data engineering, we aligned the underlying usage metrics so administrators could trust what they were seeing. The experience then brought key measures—active schools and educators, student joins, lesson sessions, and activity use—into one reporting environment.
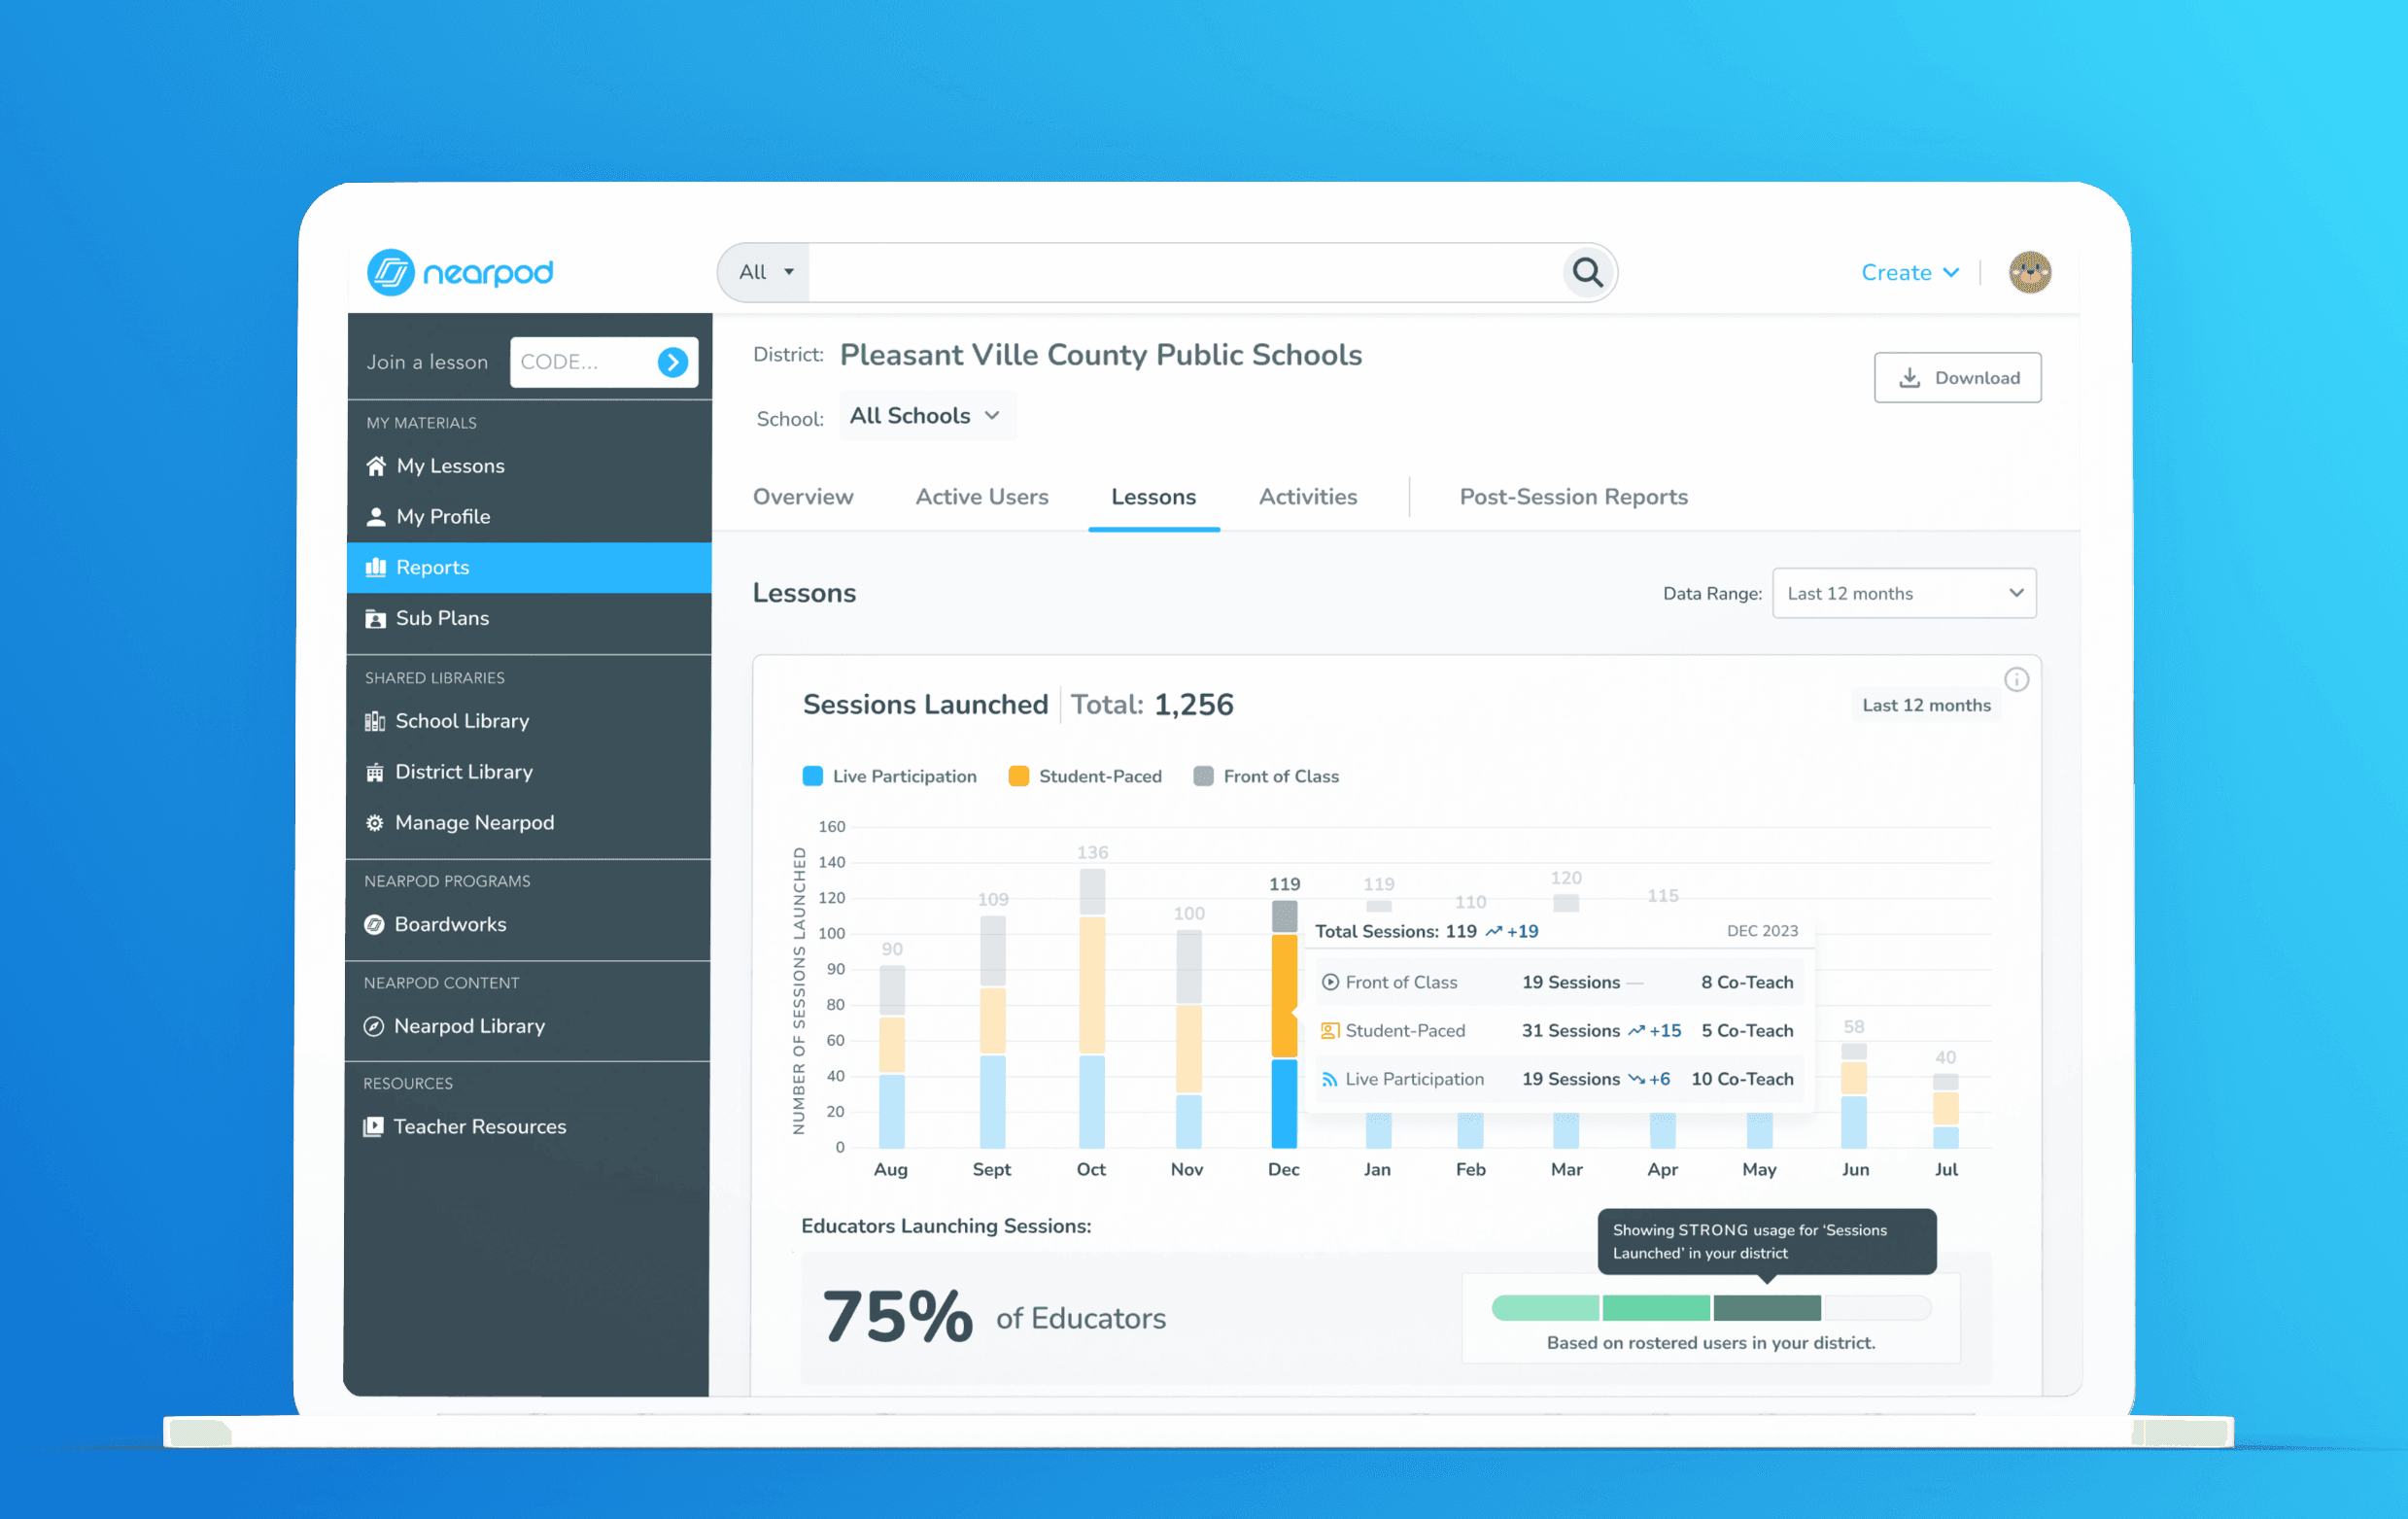
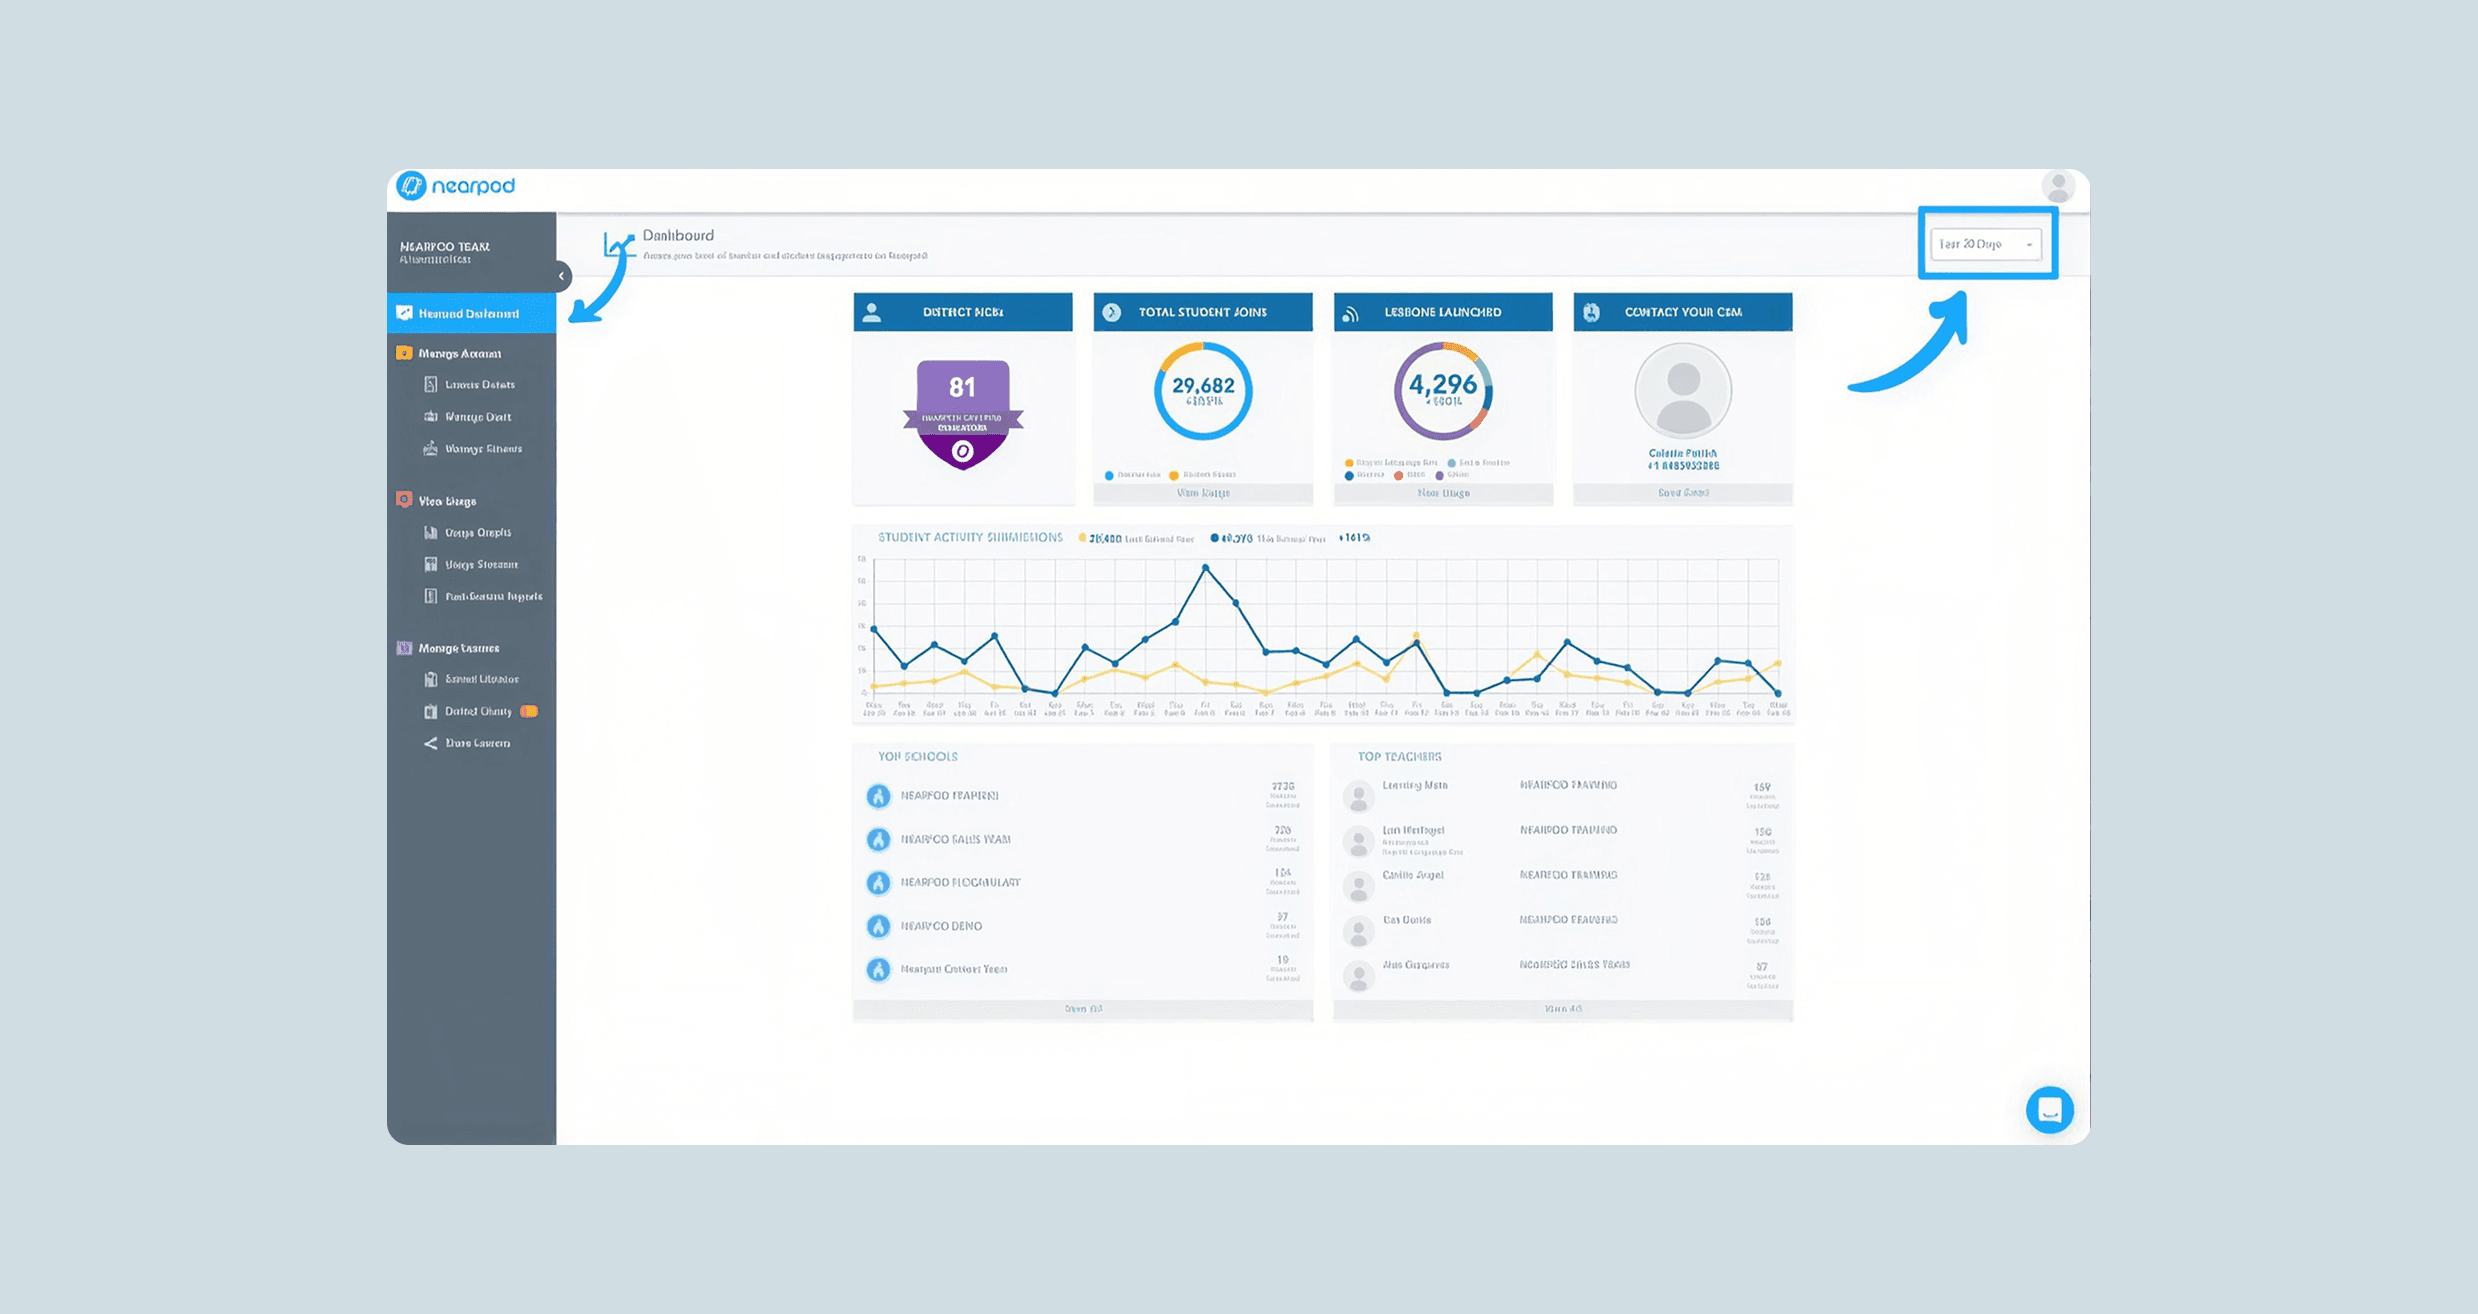
The dashboard starts with a district-wide overview and lets administrators drill down to schools and individual educators. Modular data blocks make trends easy to scan, while filters and contextual details support a closer look when needed. This gave leaders a clearer path from “How is Nearpod being used?” to “Where might our educators need support?”
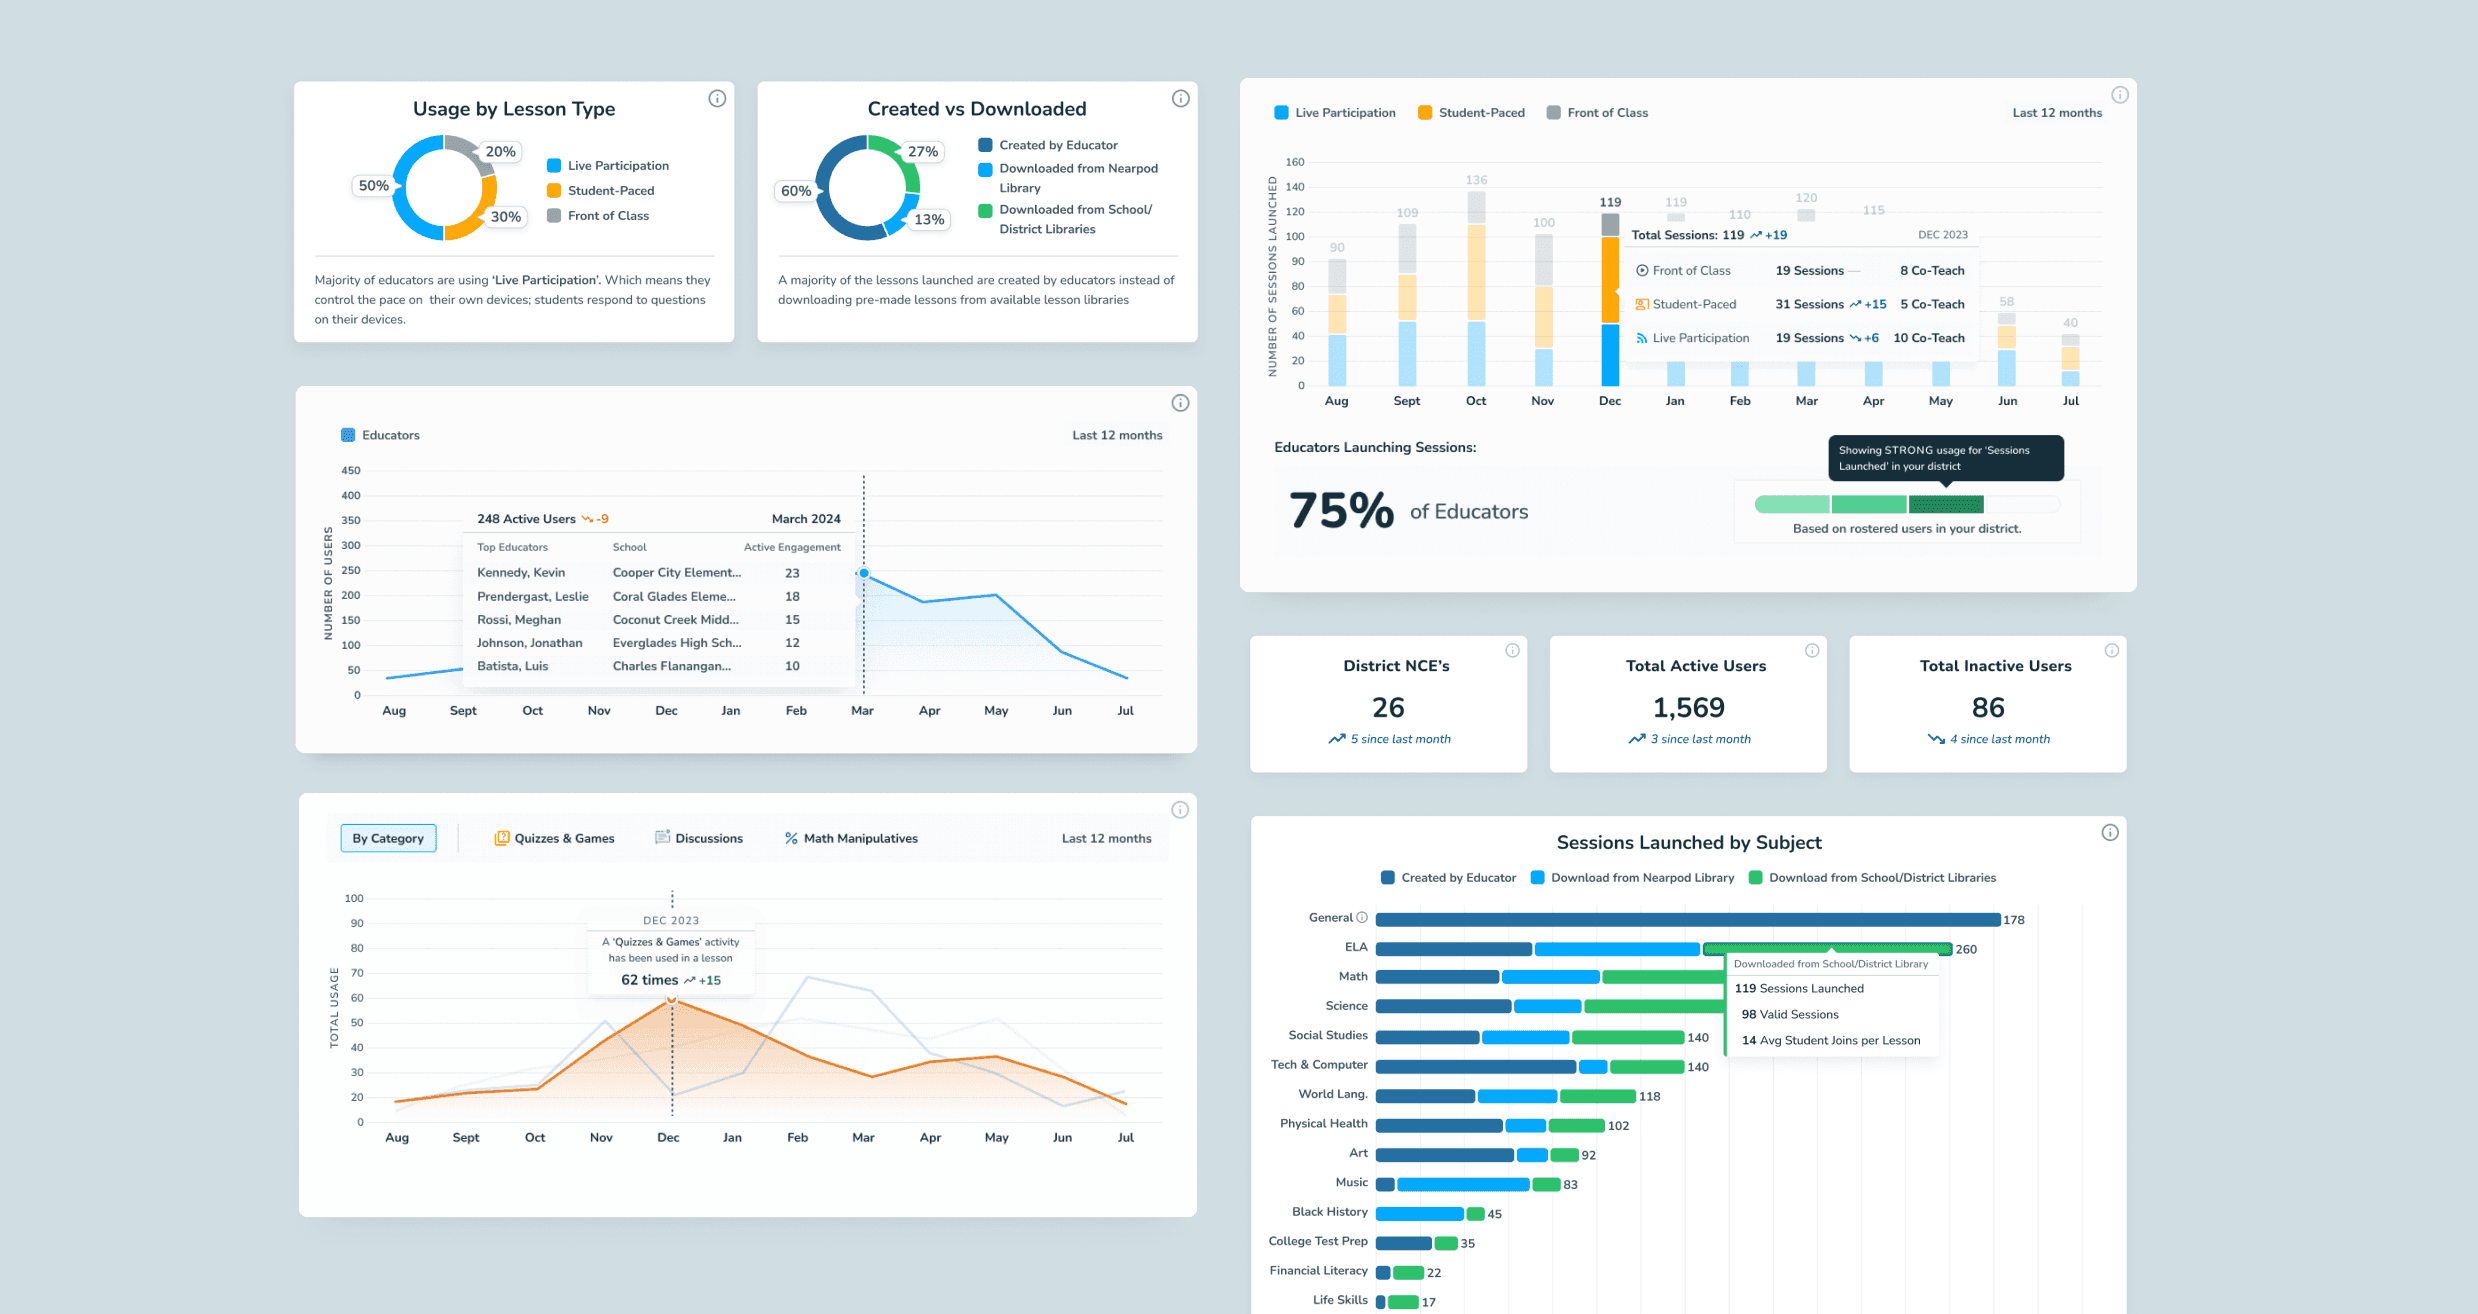
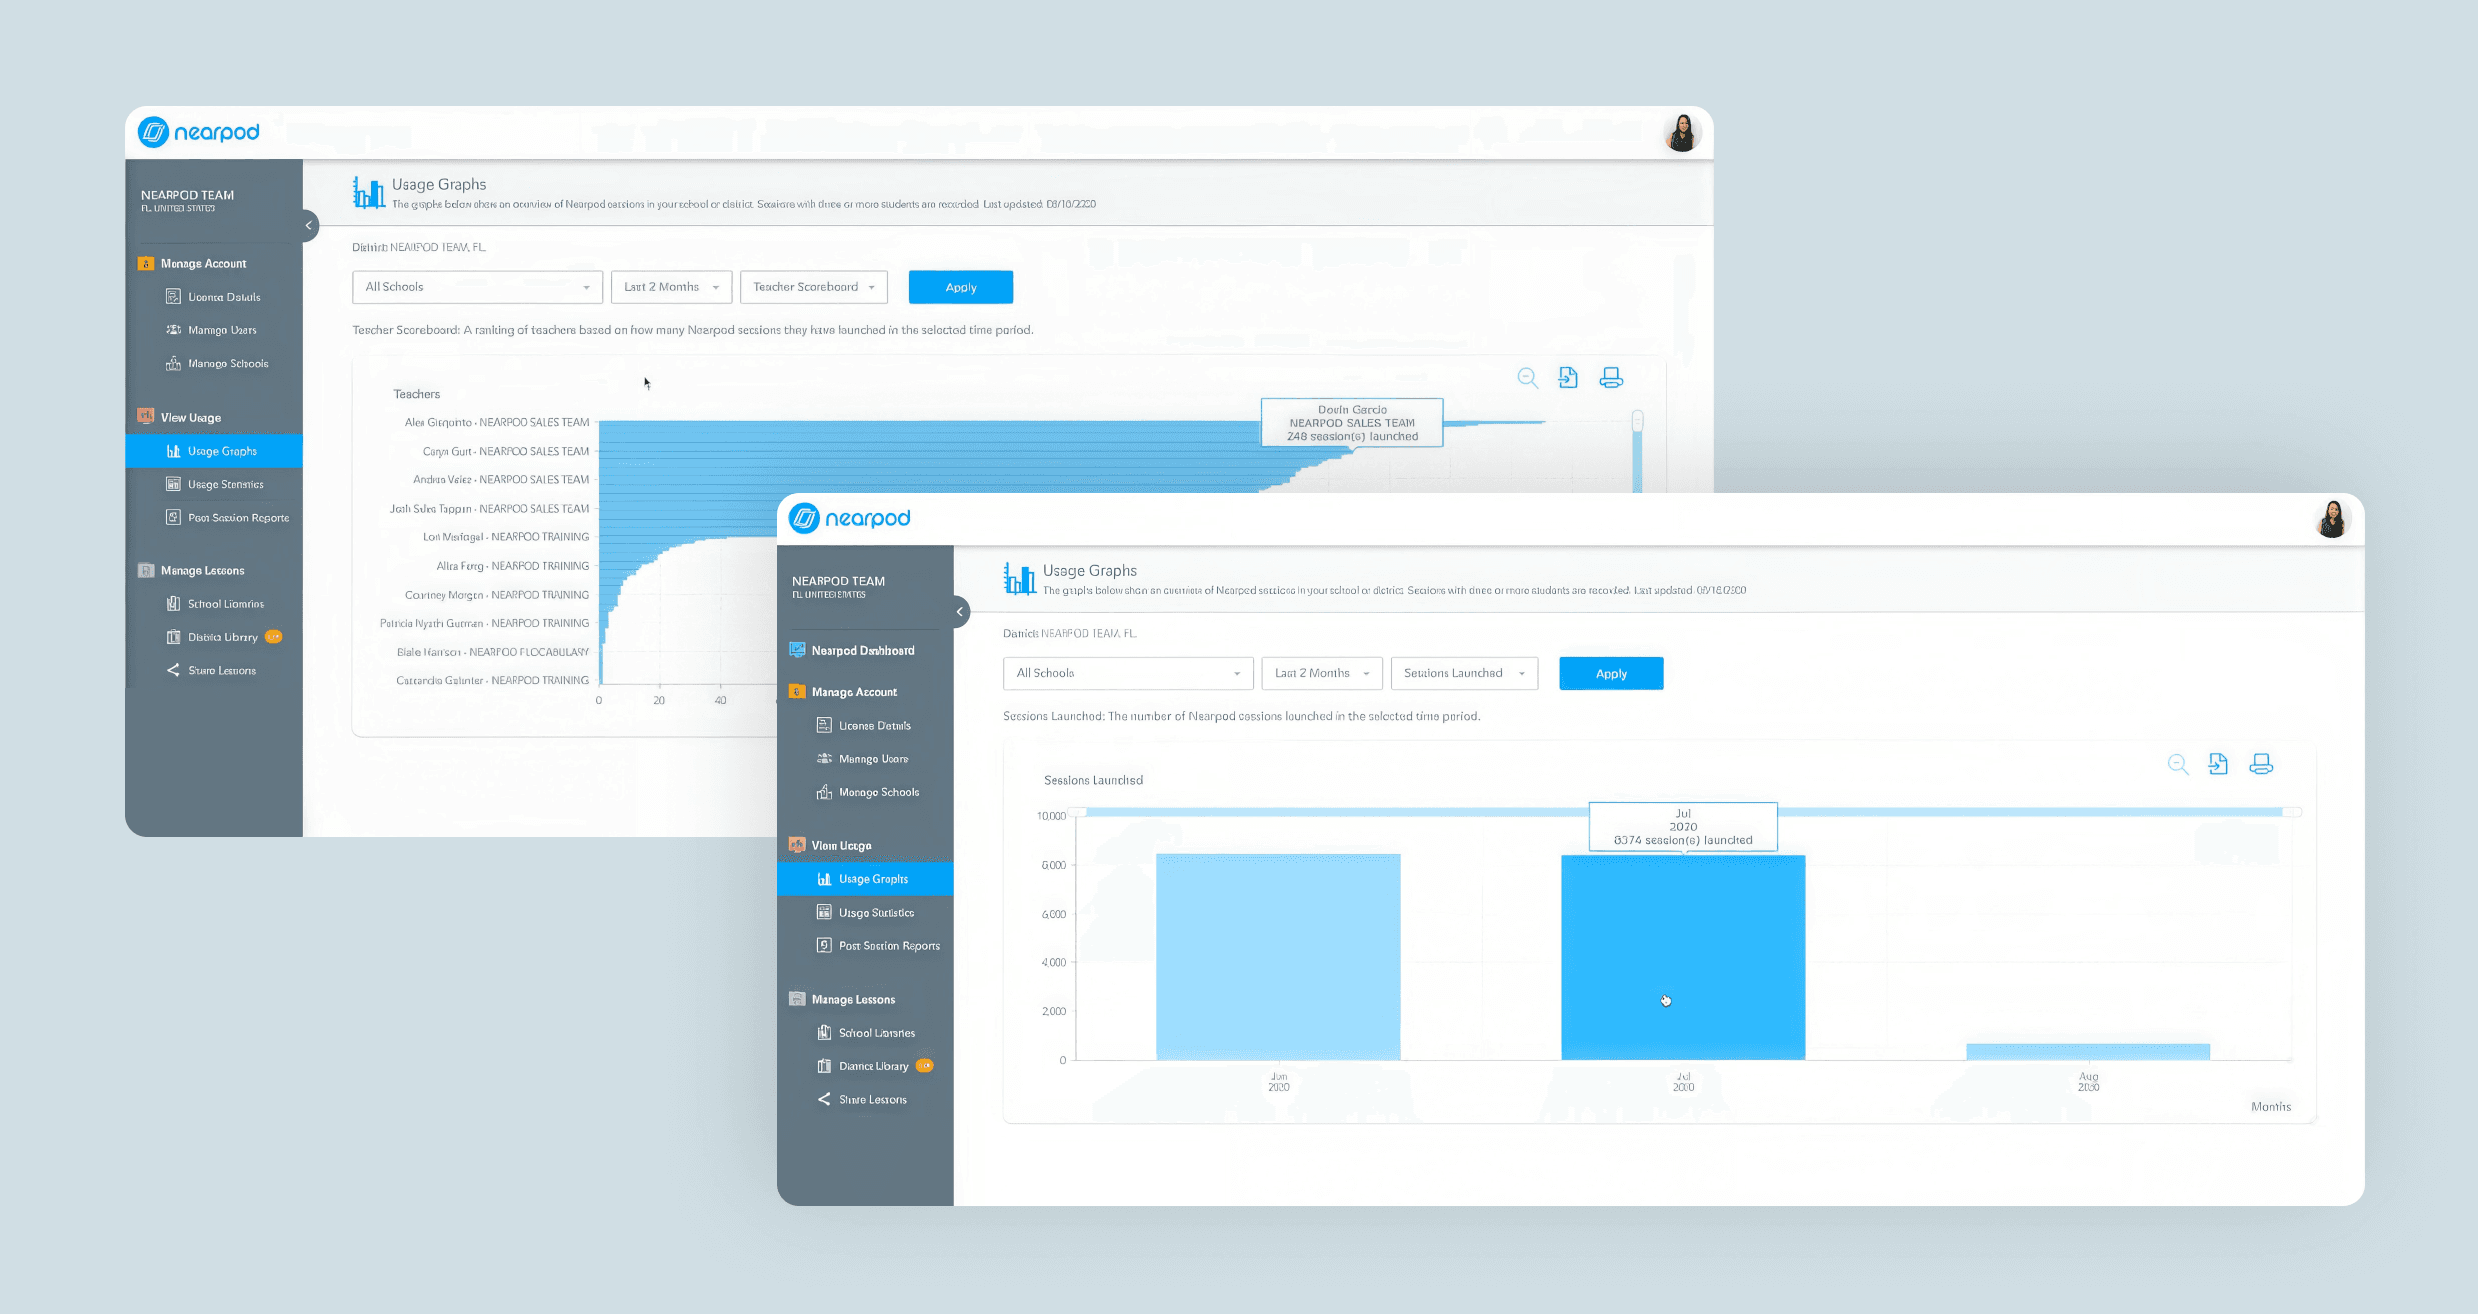
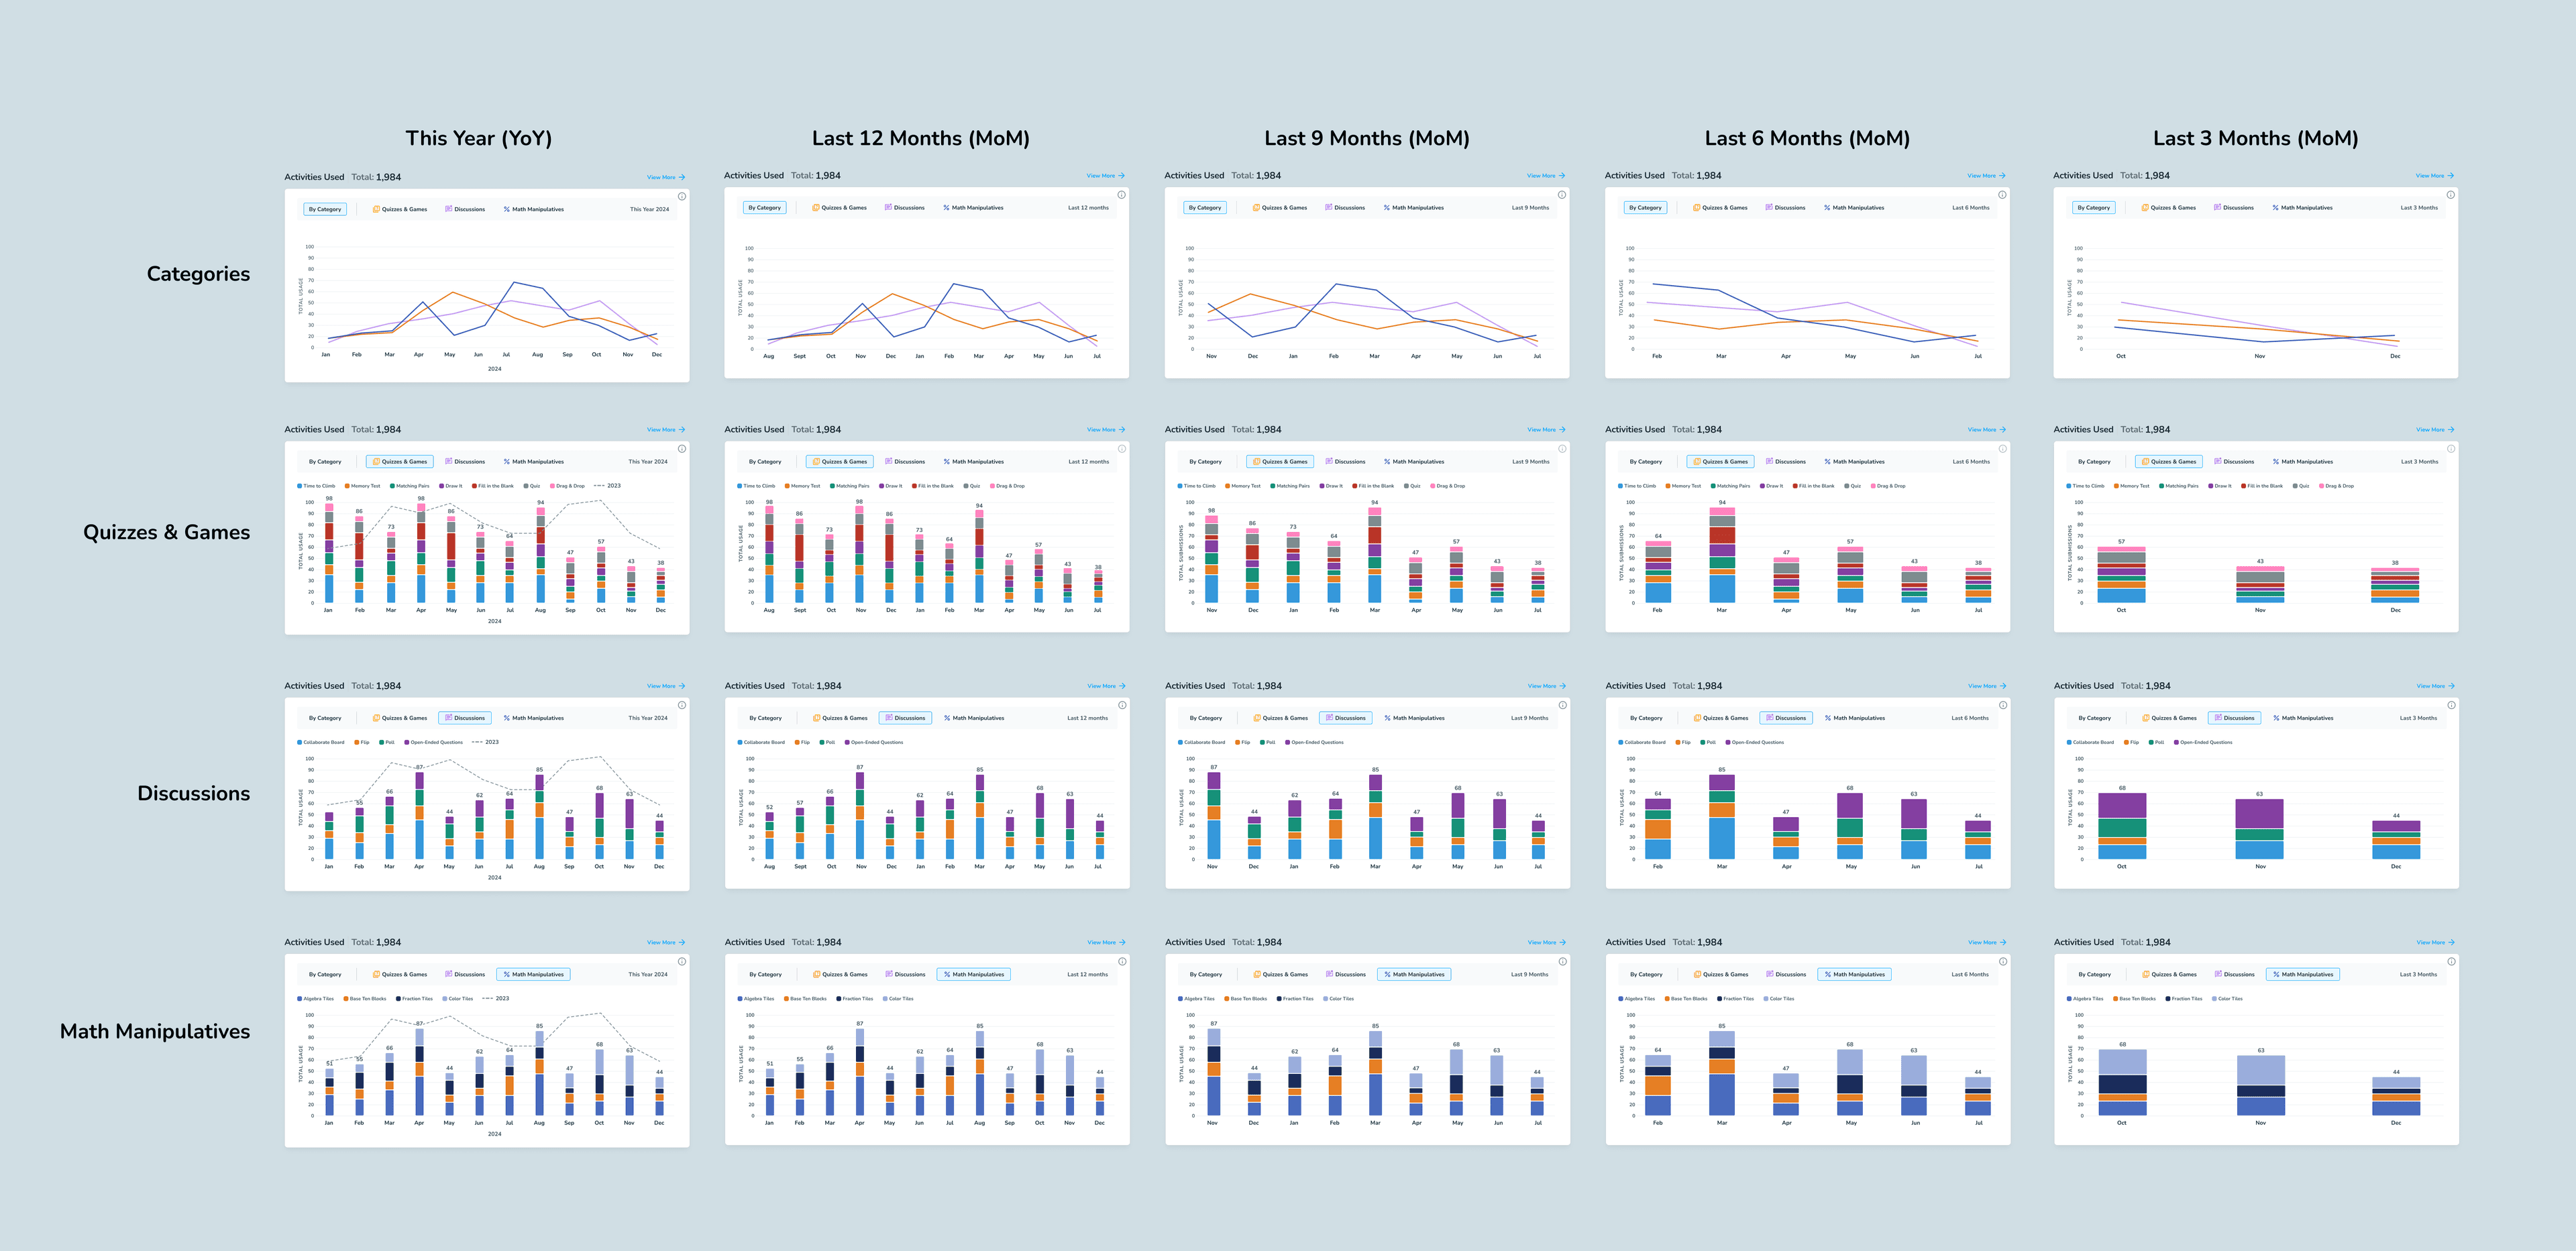
Modular data blocks: Reusable charts and metric cards make different types of usage data easier to scan, compare, and explore. 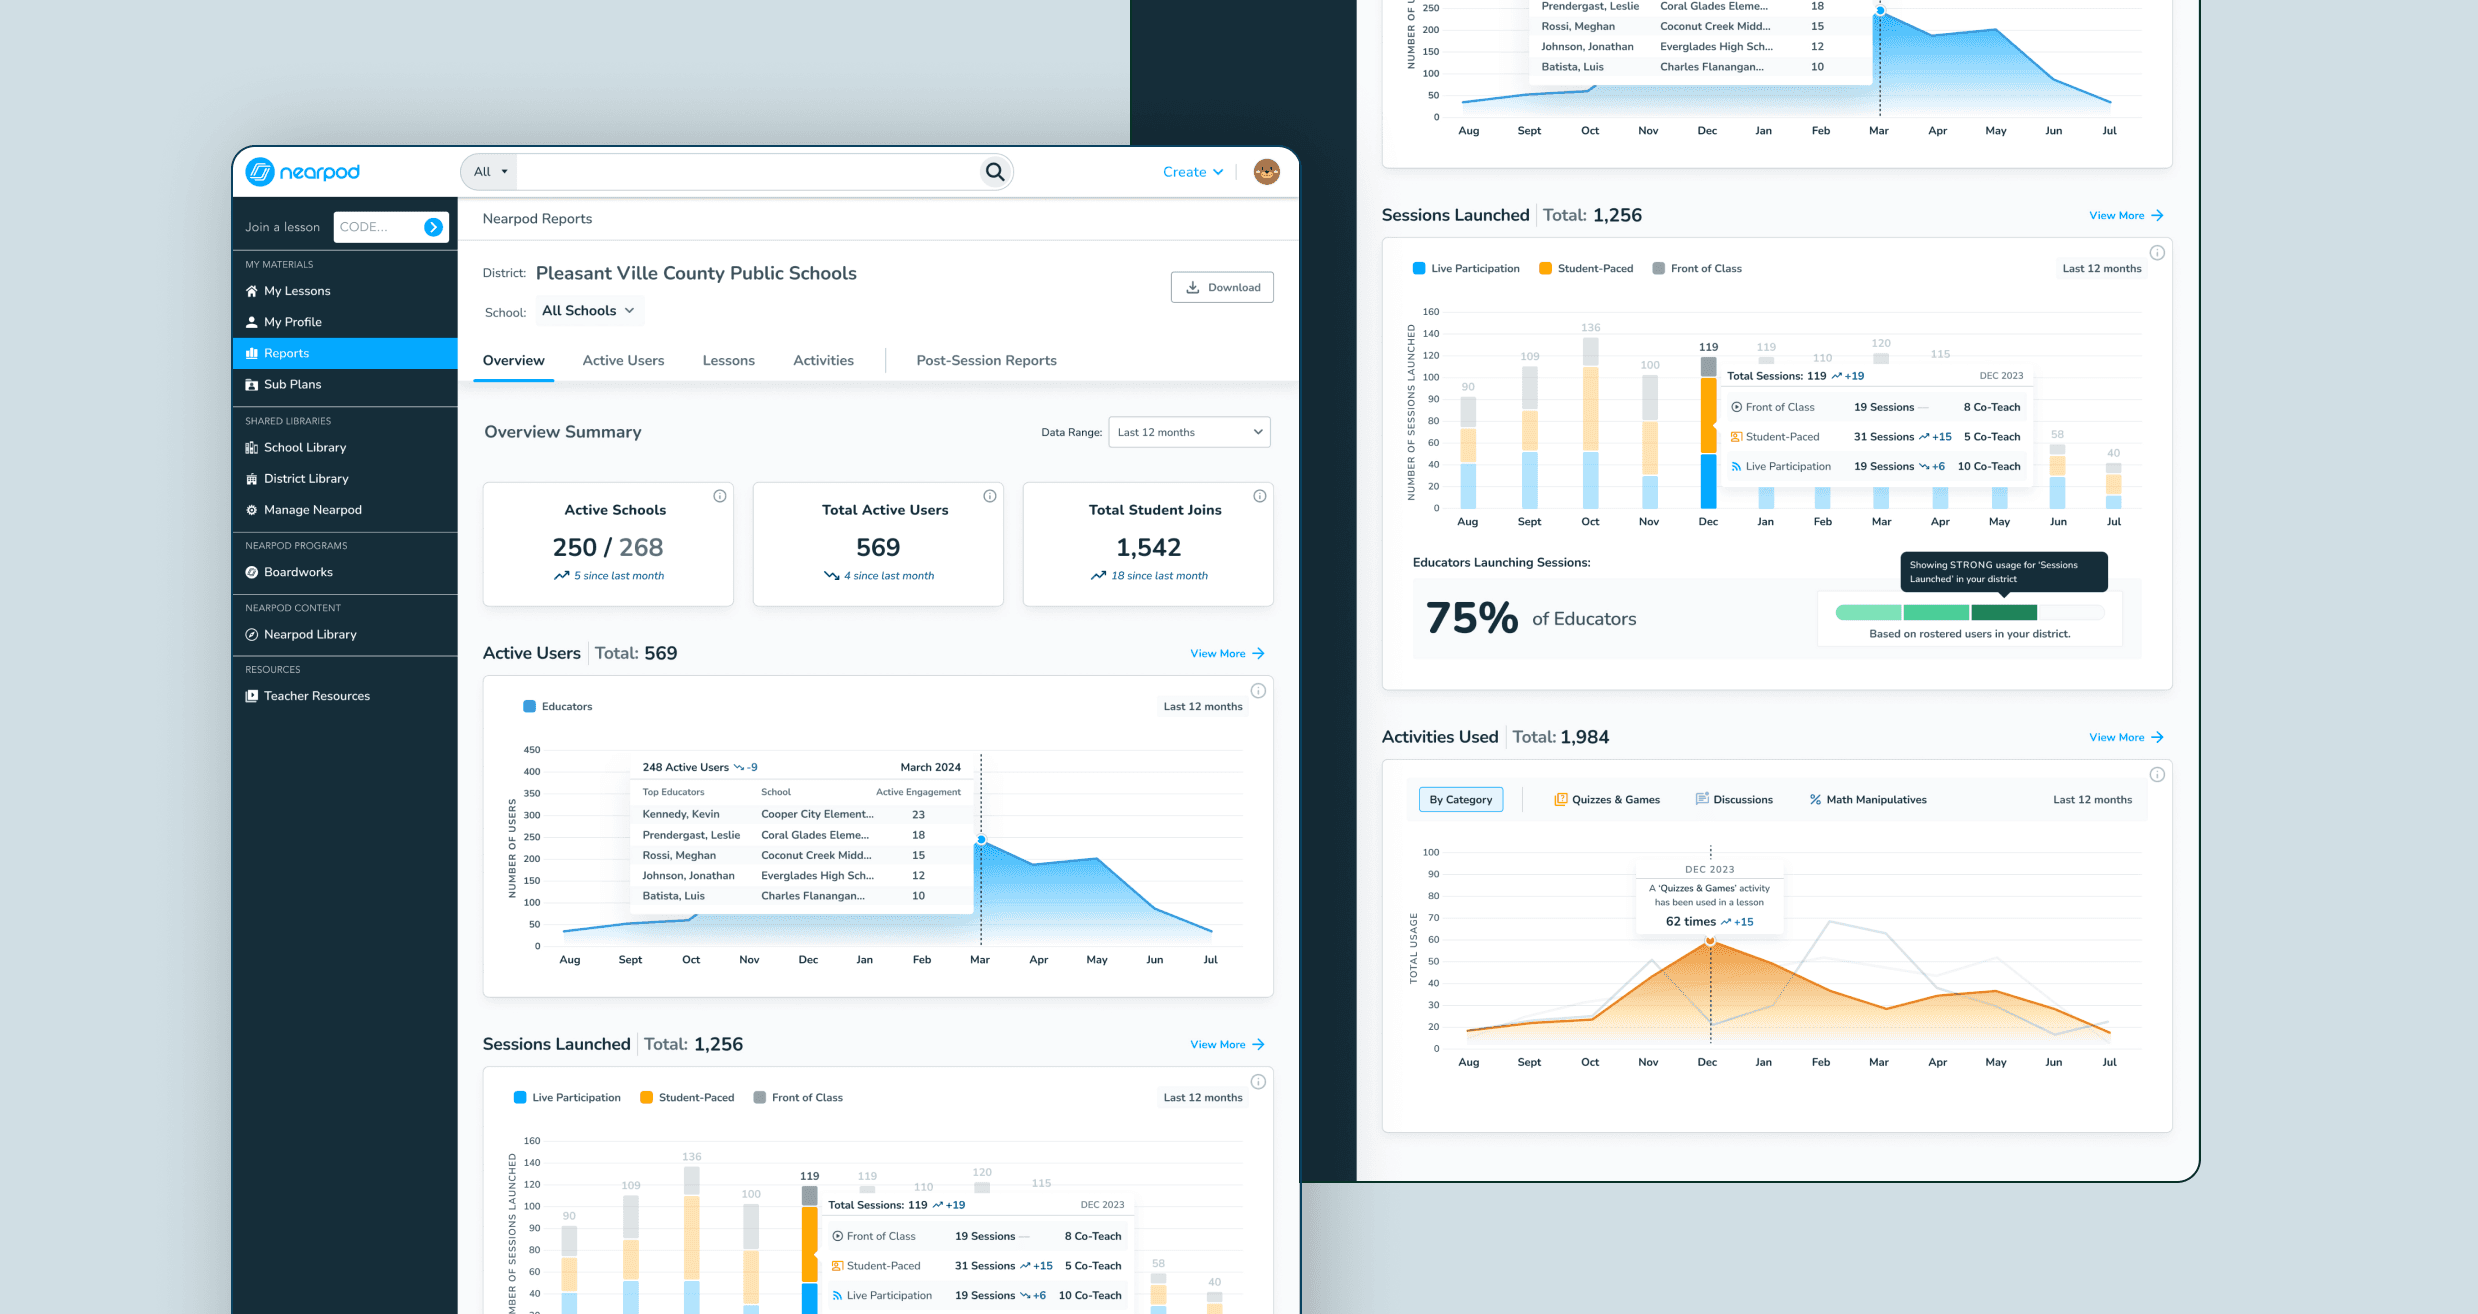
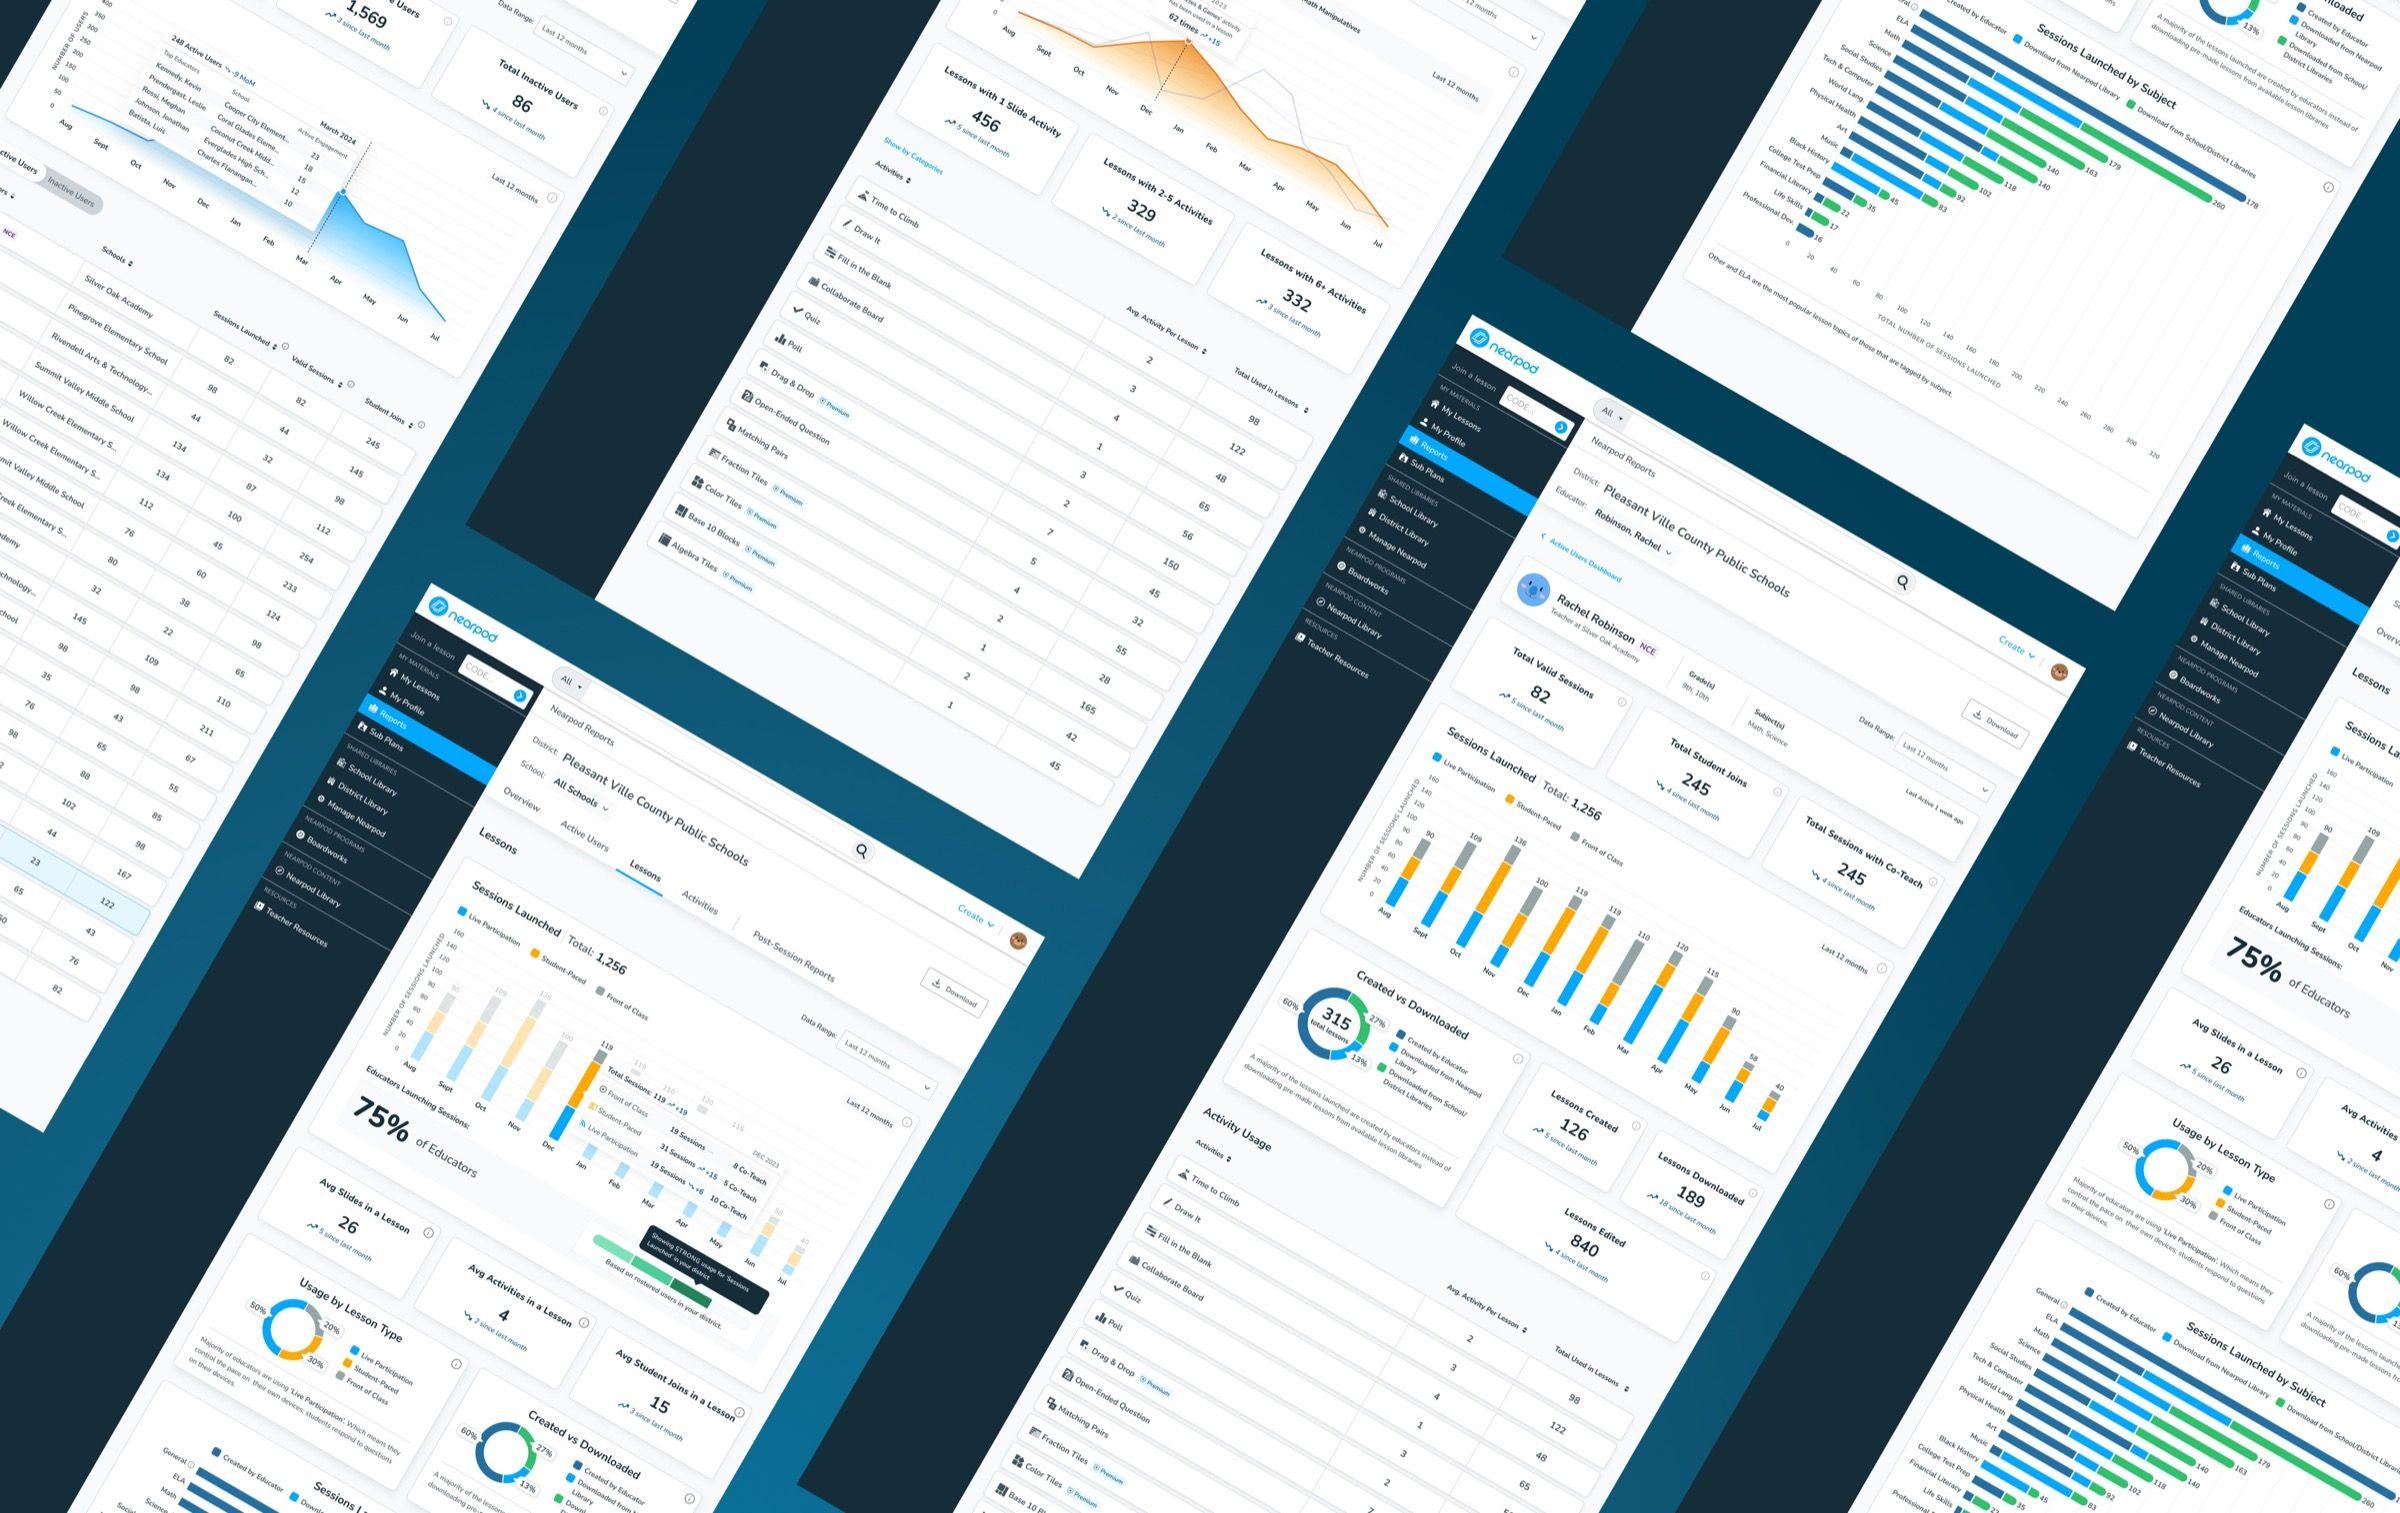
Data overview: A district-wide starting point brings adoption, student joins, and usage trends together, with paths to more detailed reports. 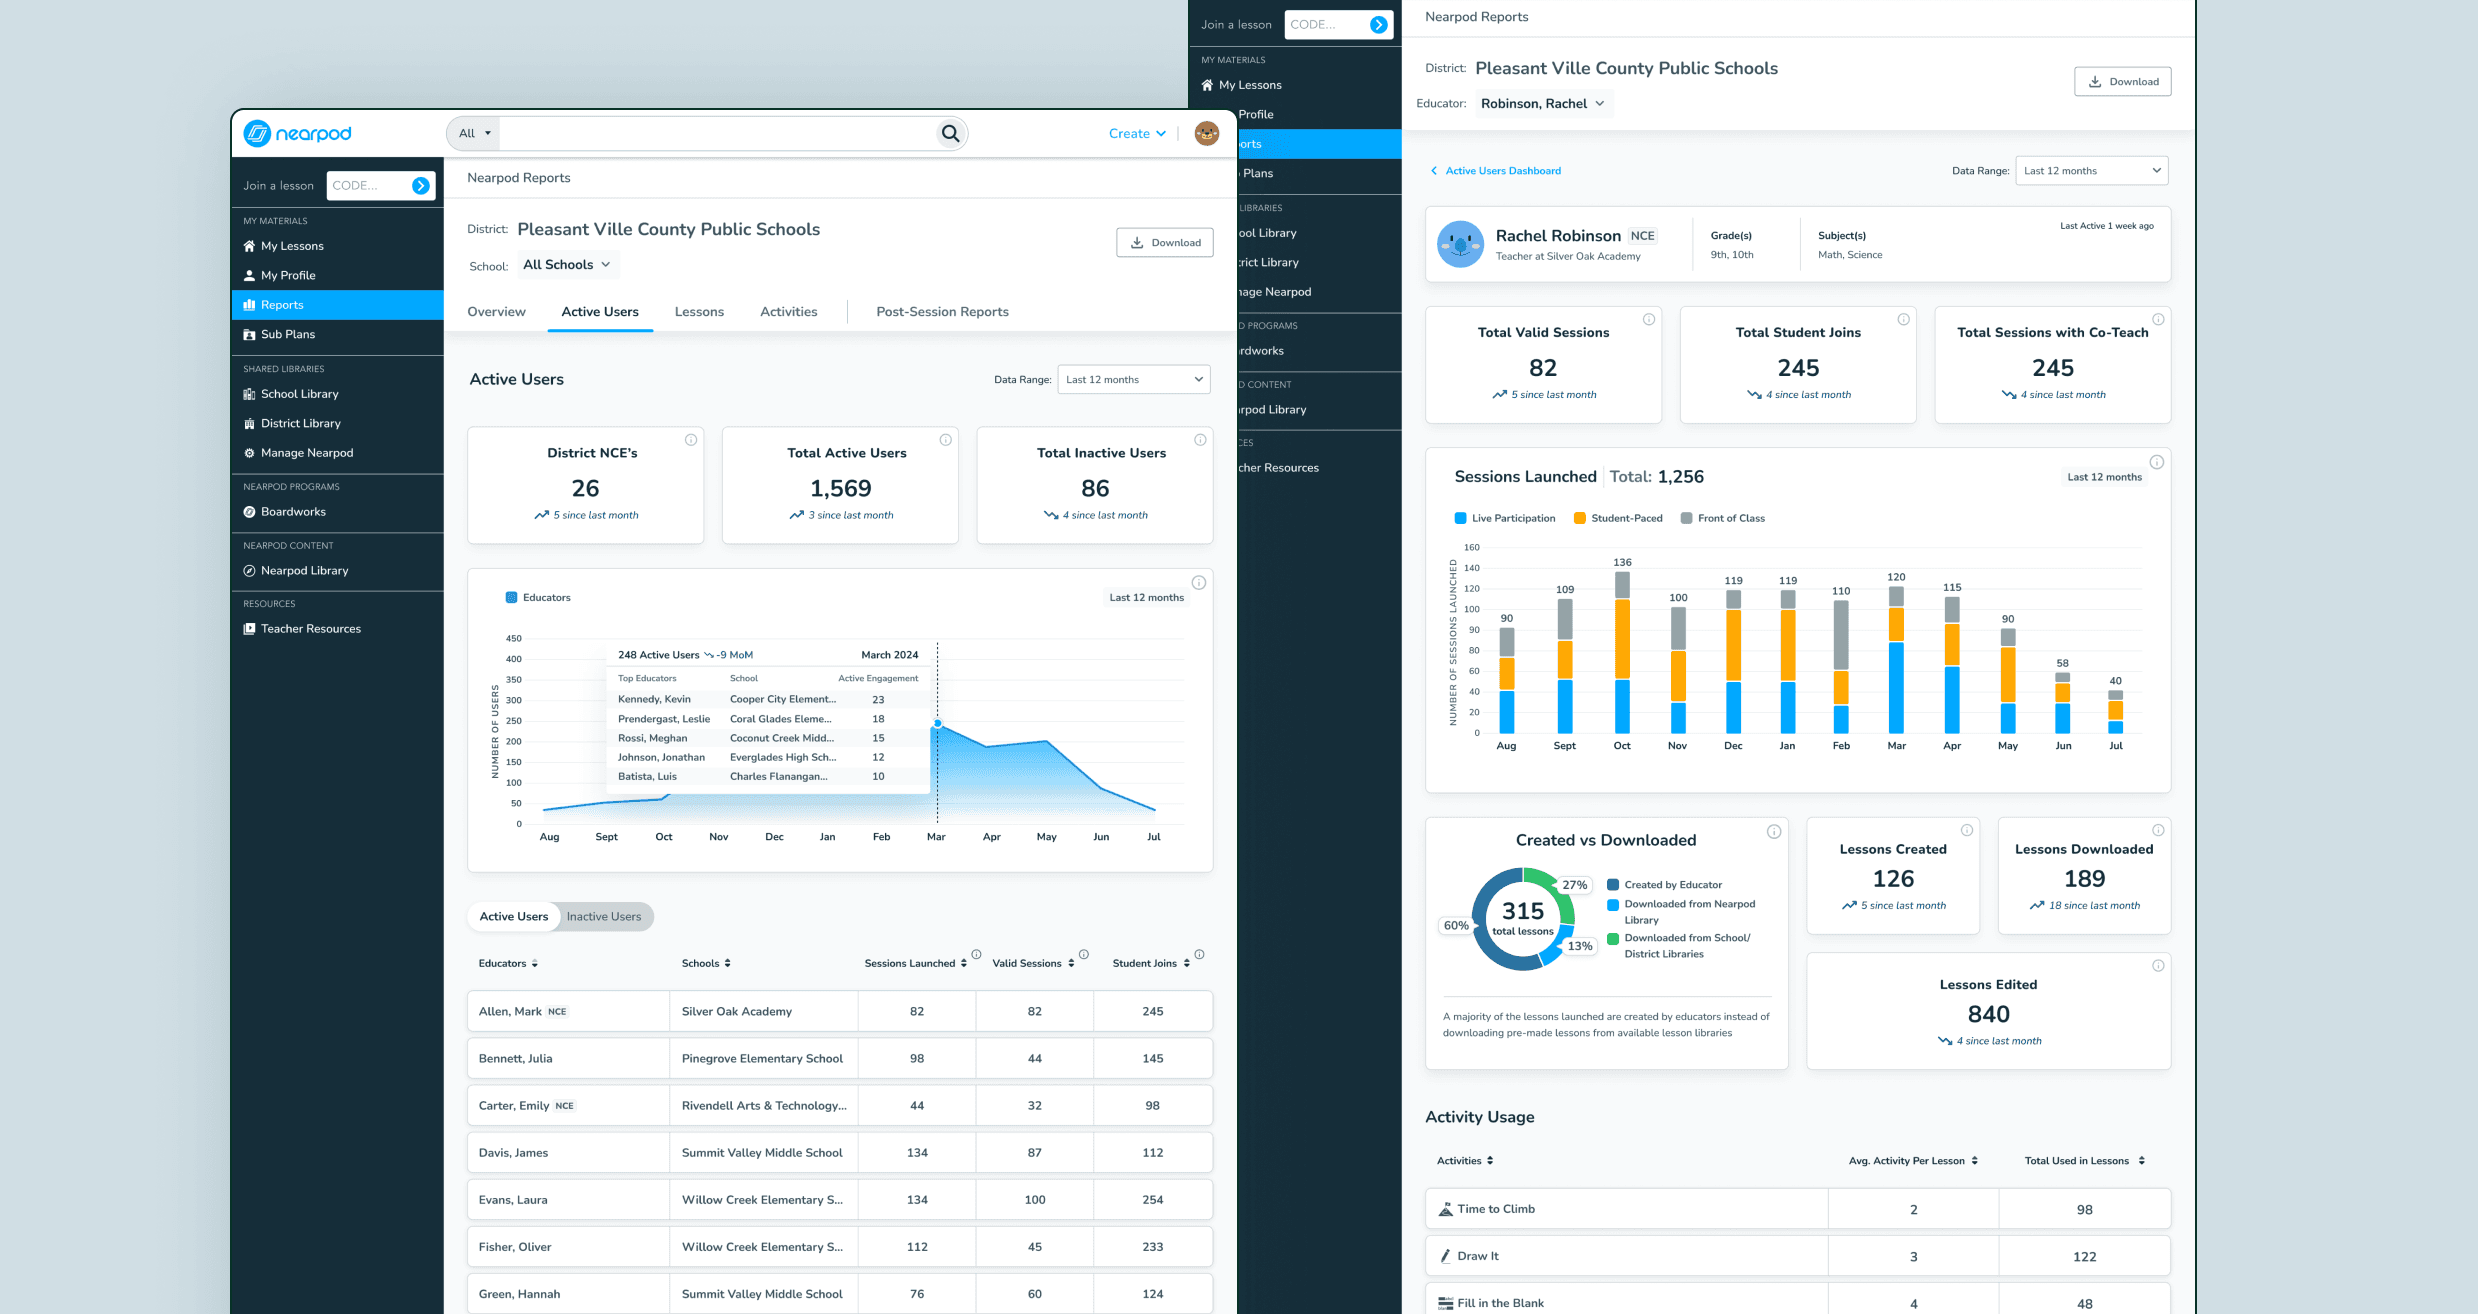
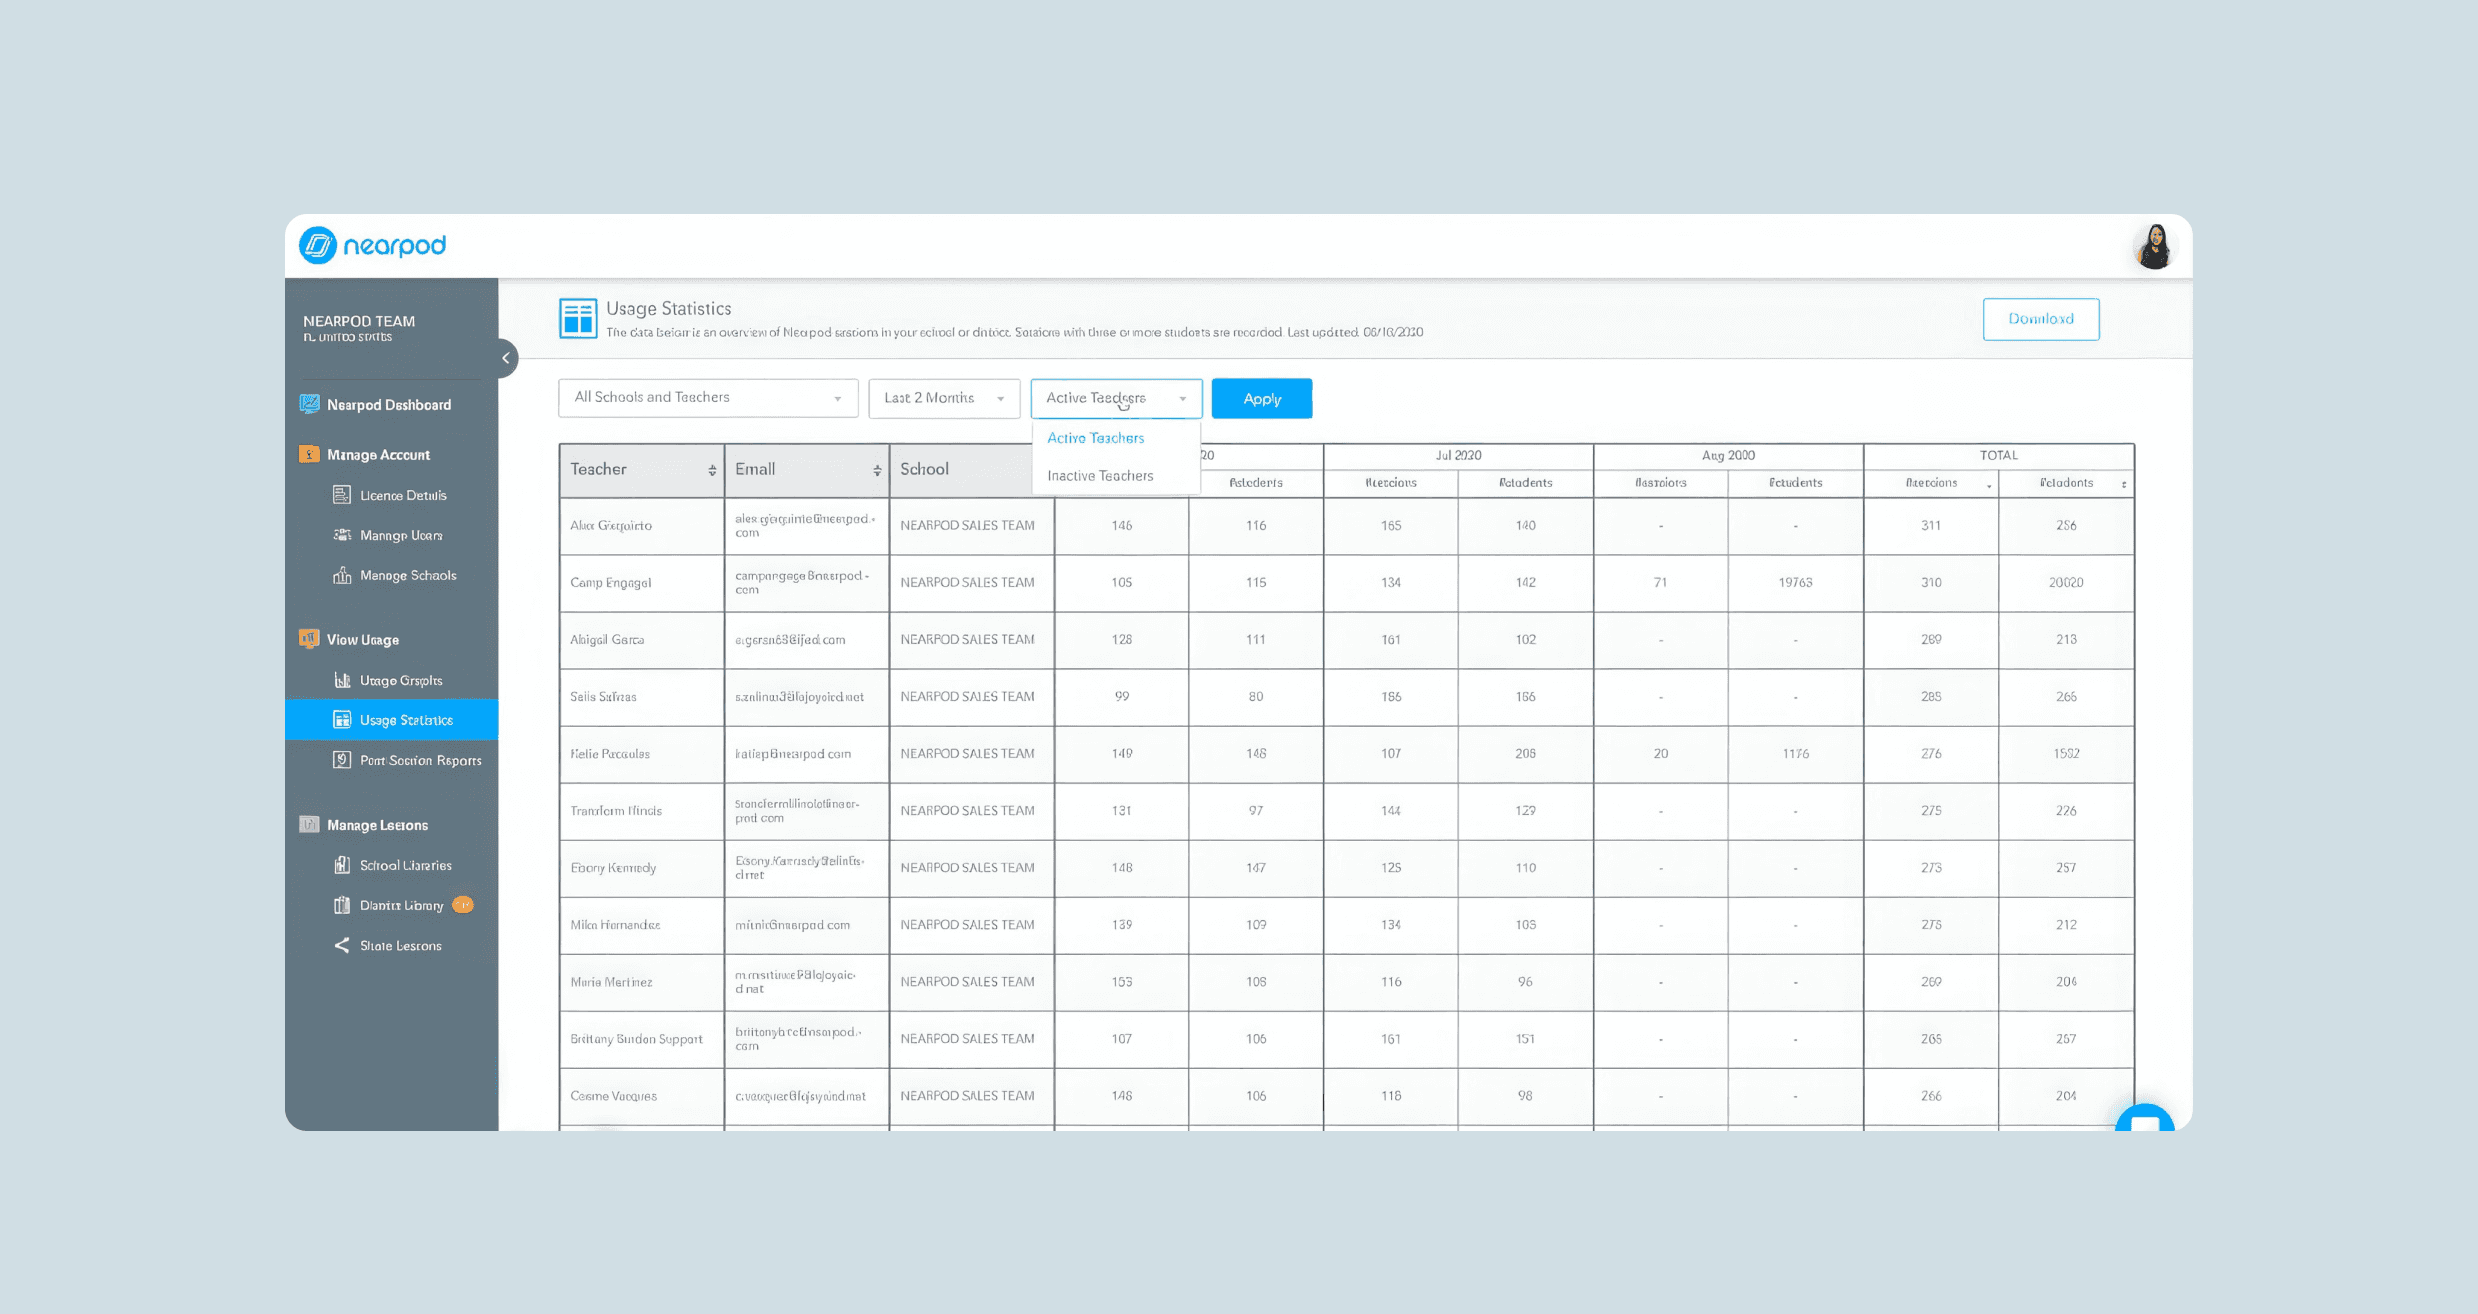
Active users and educator profiles: Administrators can move from district-wide participation to an individual educator’s sessions, student joins, and activity use. 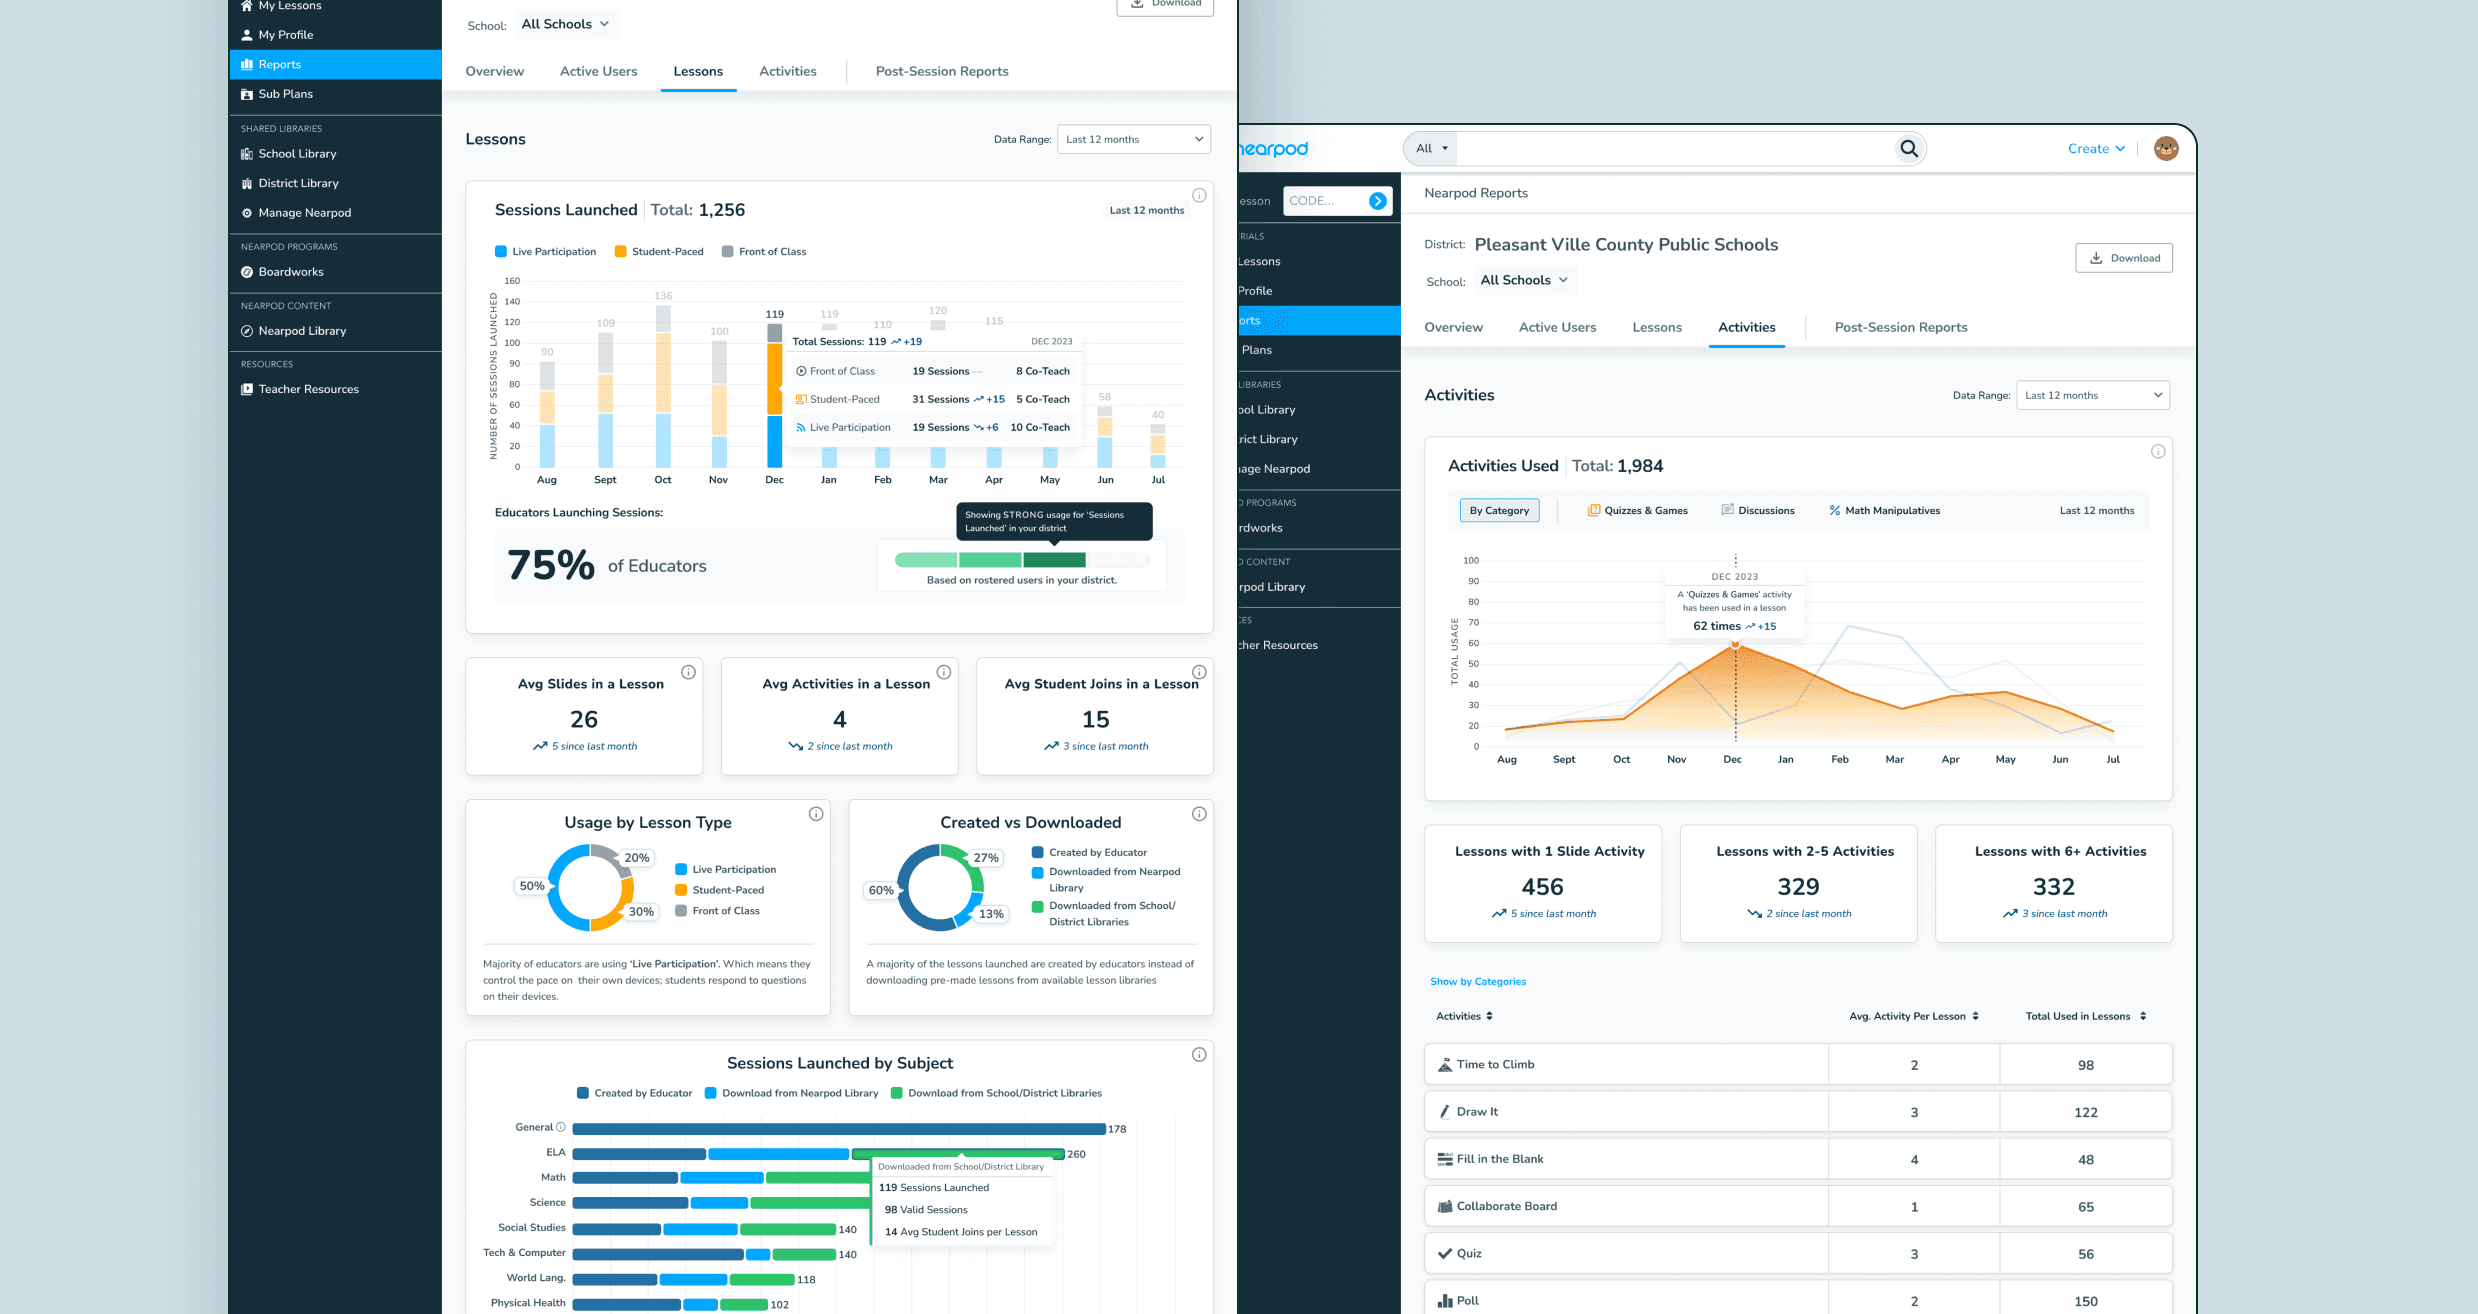
Lessons and activities: Separate views show how educators launch lessons and which activities they use, revealing patterns beyond overall session counts.
Challenge
The hardest part was not choosing charts. Usage data came from different parts of the product, and inconsistencies in the underlying reporting made some metrics difficult to interpret with confidence. I worked with product and data engineering to clarify metric definitions while designing views that stayed useful across districts, schools, time periods, and varying levels of available data.
There was also a scope decision. In moderated research, administrators made clear that student assessment outcomes were important to how they judged Nearpod’s value. We could not deliver that view in the first release, so the dashboard focused on dependable adoption and instructional-usage reporting. Student outcomes remained a critical direction for future work—not a need the launch had solved.
Outcome
The redesigned Reports Dashboard gave school and district leaders a clearer, self-serve view of Nearpod adoption and instructional use. Its modular structure also made room for additional metrics as reporting needs evolved.
Following launch, we observed two encouraging results:
- Administrator engagement: District and school administrator engagement increased 26%, with more consistent logins and reporting sessions throughout the academic year.
- Renewals: Accounts using the dashboard for regular reporting renewed at a 30% higher rate than those that did not. This showed a strong association between reporting use and renewal, though it does not establish that the dashboard caused the difference.
The next opportunity was to connect usage with student assessment outcomes. Administrators raised this need in research, but it was outside the first release. The dashboard helped leaders see how Nearpod was being used; future reporting could help them understand what that use meant for student growth.
Want the deeper walkthrough?
These case studies are intentionally concise. For a closer look at the thinking, craft, and decisions behind the work, reach out.