
- EdTech
- Data Dashboard
Turning vocabulary engagement into visible progress
I designed an end-to-end vocabulary experience that connected student practice, teacher decisions, and district reporting—giving educators a clearer view of progress and schools better evidence of Flocabulary’s value.
- Year
- 2023
- Industry
- EdTech
- Company
- Renaissance
- Role
- Product Designer
- Capabilities
- Product design, Data visualization, Usability testing
Problem
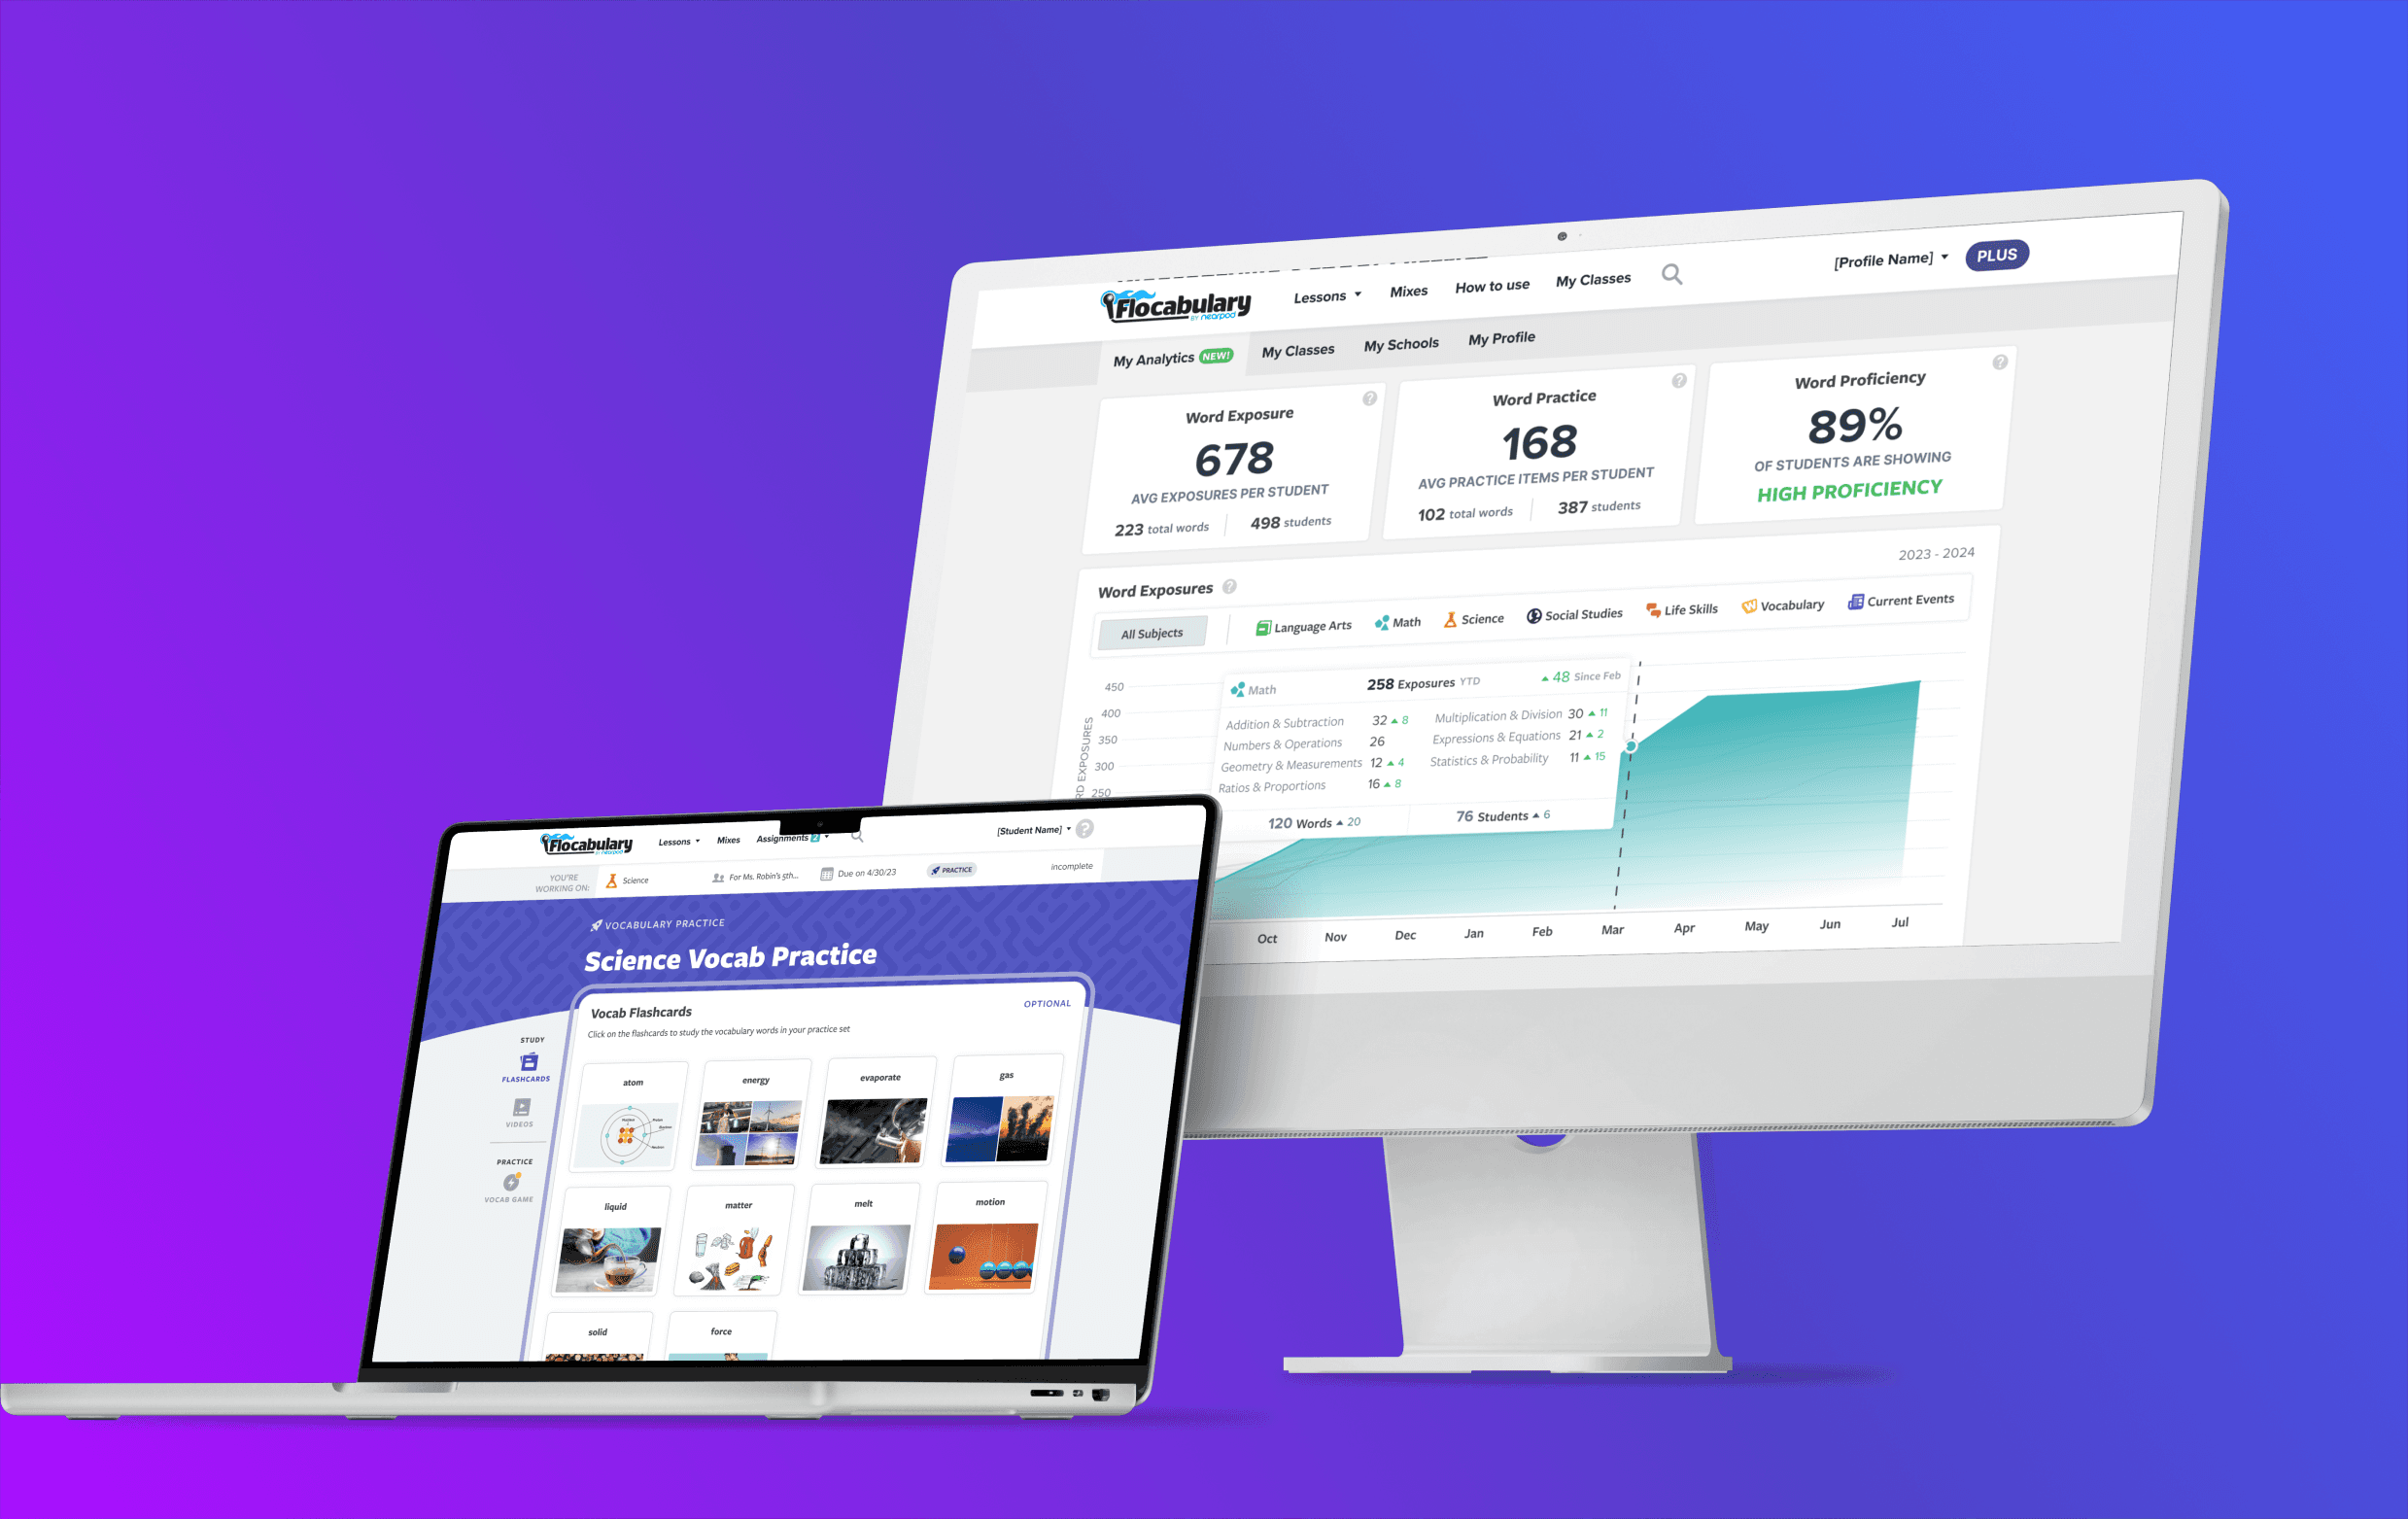
Flocabulary gave students engaging ways to learn vocabulary, but districts had no clear view of how the product was being used or what impact it was having. That made it harder for administrators to demonstrate value at renewal. Teachers could see results for individual lessons, but not how students’ vocabulary skills were developing over time.
Without a view of those patterns, teachers struggled to identify where students needed support and re-engage them with relevant practice. The opportunity was to connect student learning, teacher action, and district-level evidence of impact—strengthening the value of Flocabulary for both educators and subscribing schools.
Solution
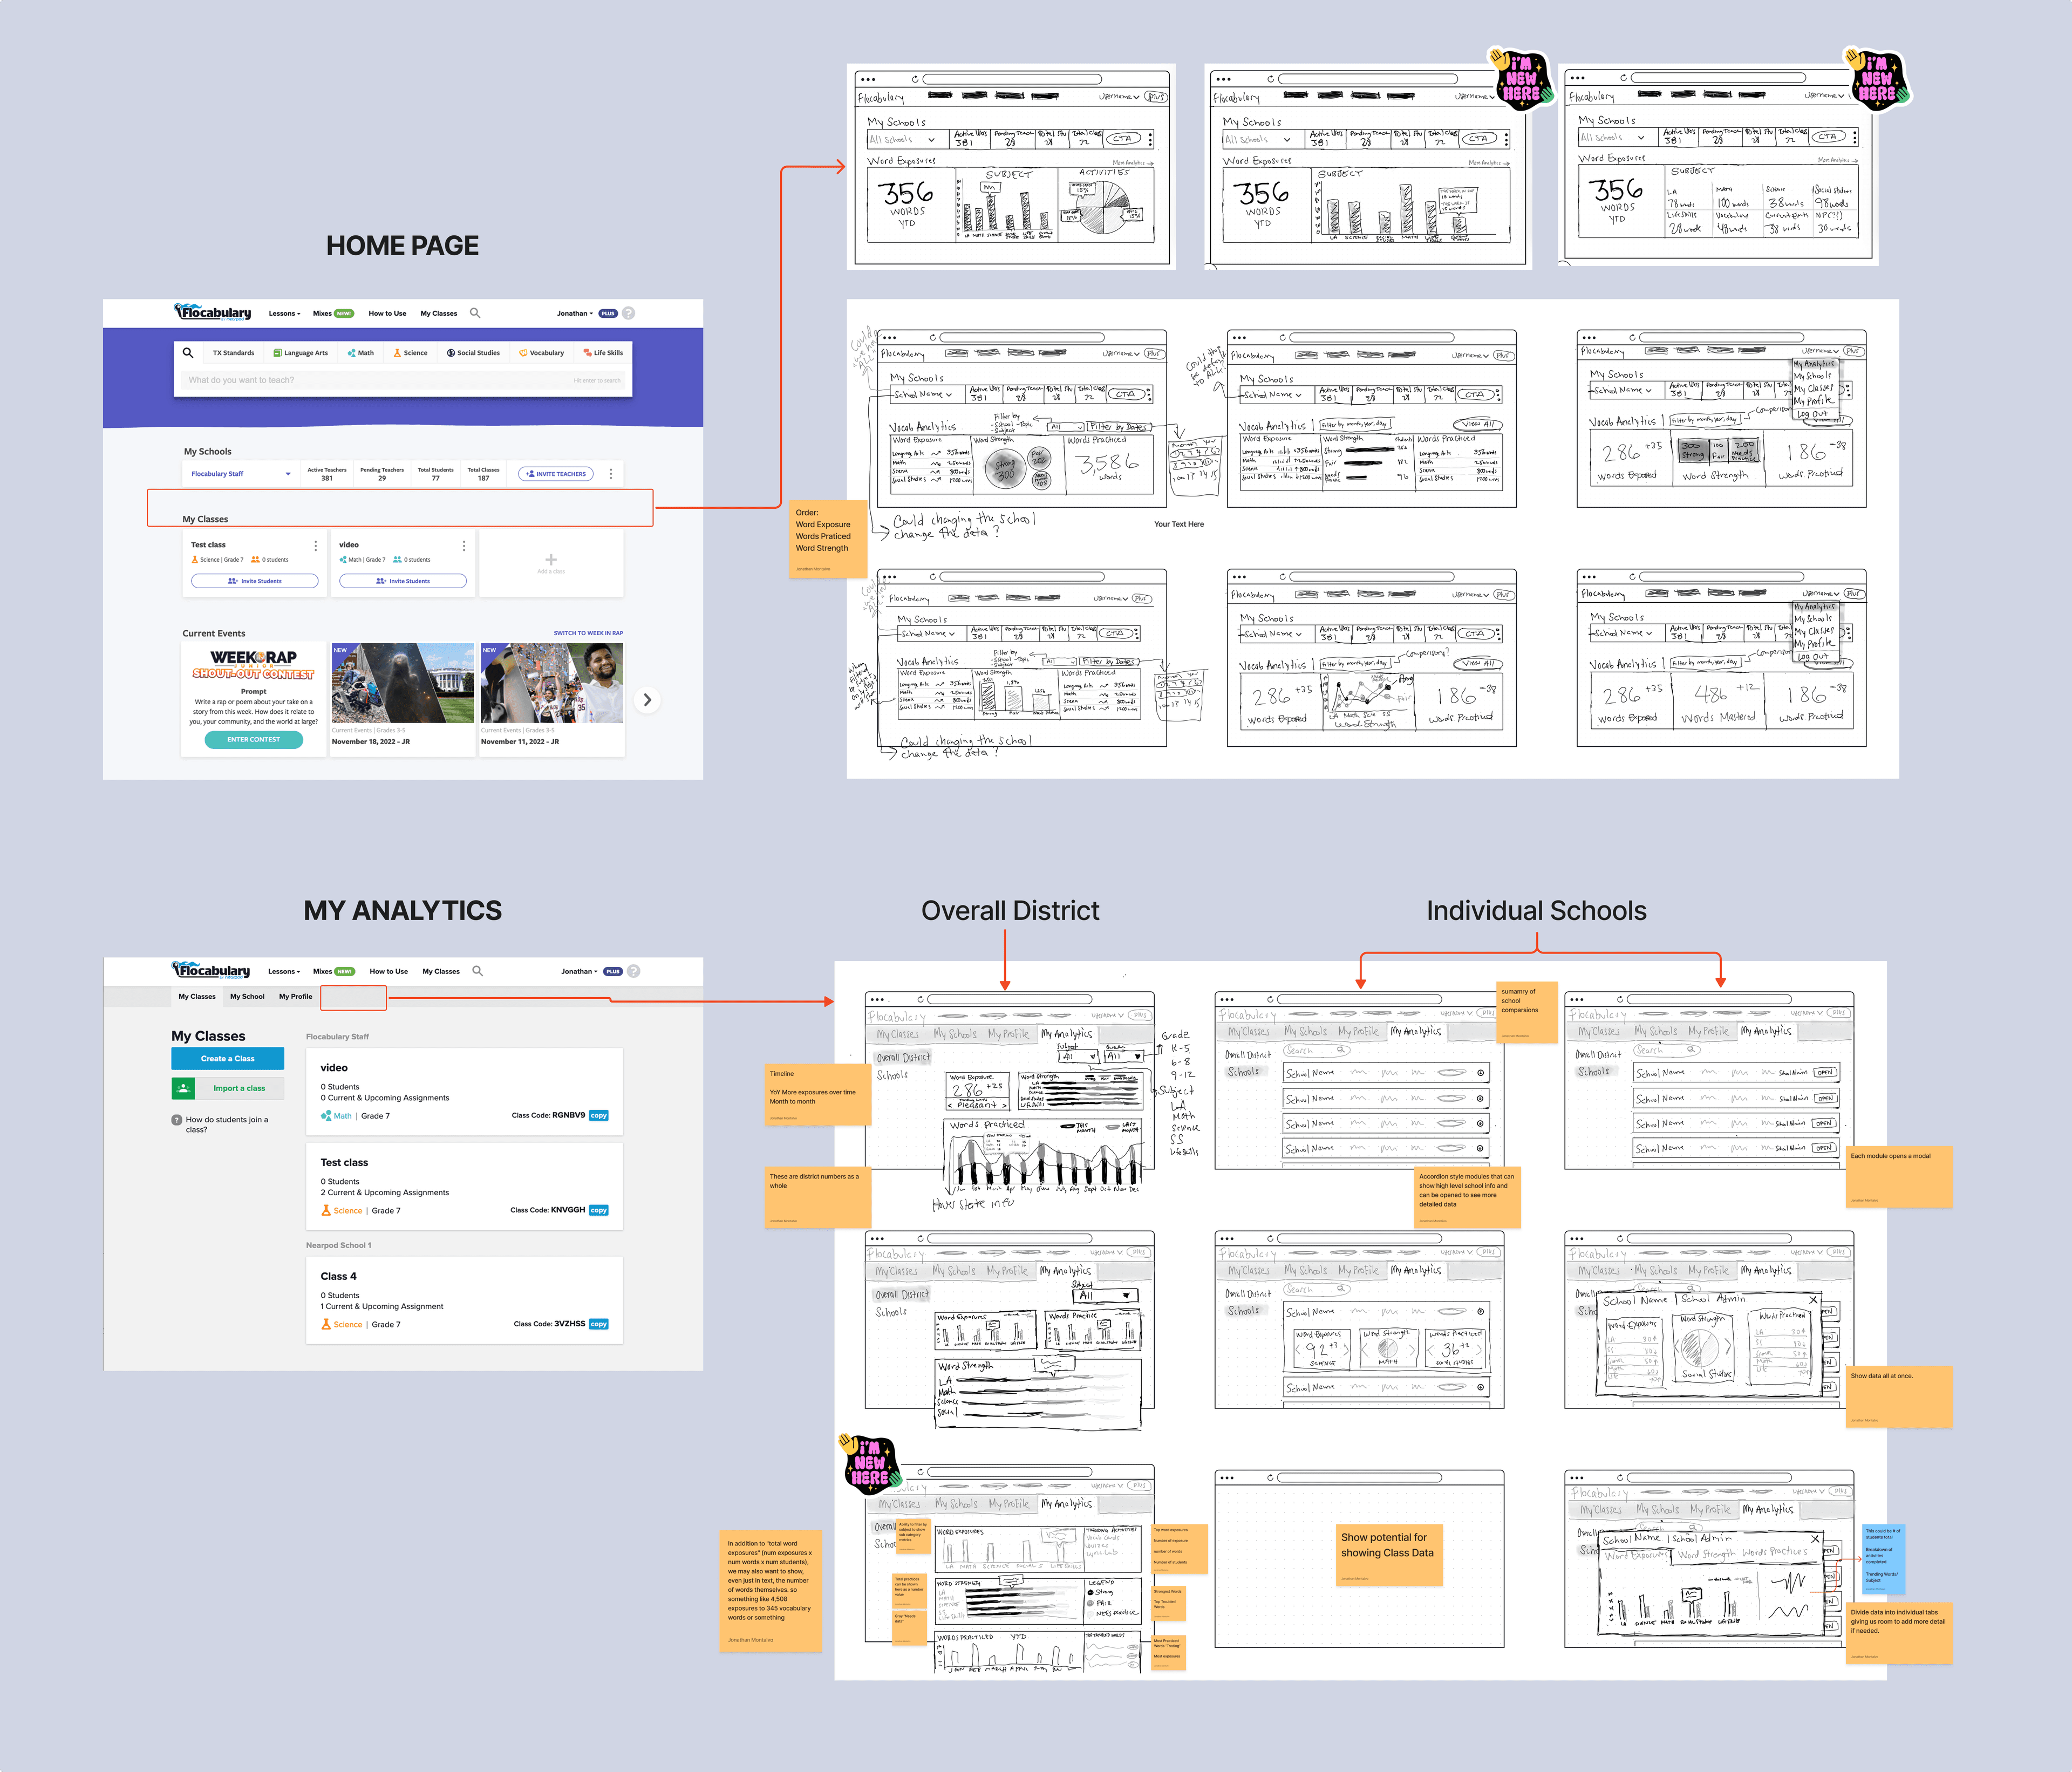
I designed a connected vocabulary experience across district administrators, teachers, and students.
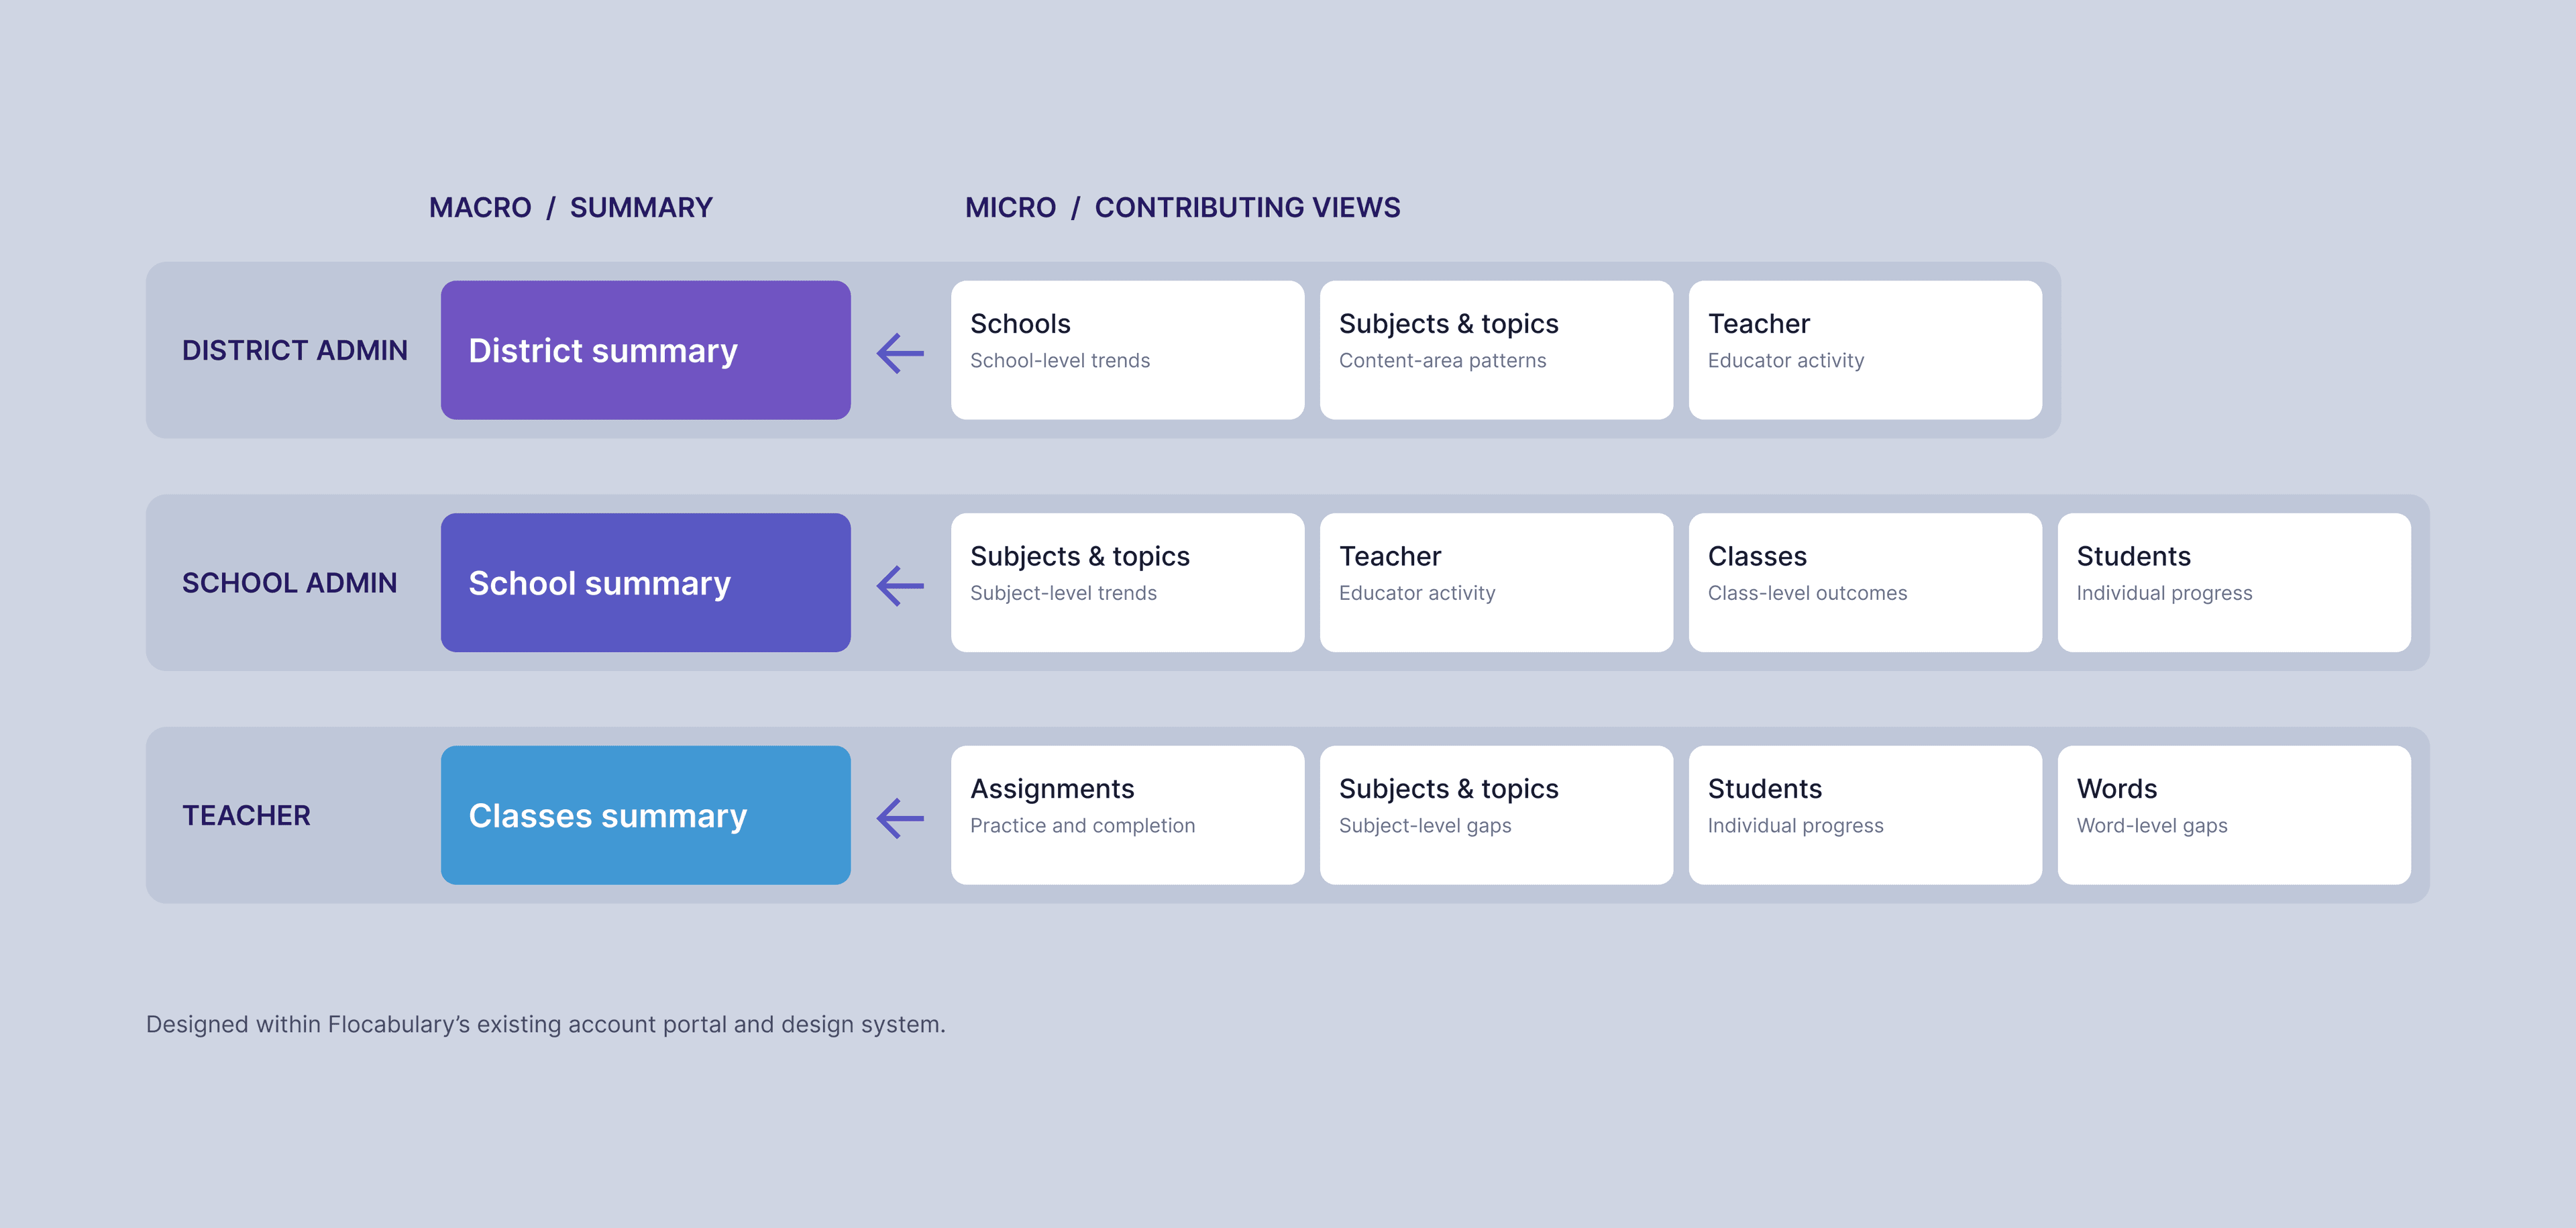
Administrators could view district-wide data and drill down into schools and grade levels. This visibility revealed which schools or teachers showed limited vocabulary progress, enabling admins to intervene with actionable guidance on how to integrate Flocabulary more effectively.
Teachers gained class- and student-level insights, with proficiency grouped into high, medium, and low categories. The dashboard automatically generated targeted practice: flashcard exercises, videos, and even a customized vocabulary game where students built beats for every correct fill-in-the-blank response. As students completed exercises, their literacy levels adjusted in real time, creating a living feedback loop for growth.
This dual experience aligned stakeholders around a shared goal — reinforcing vocabulary acquisition and making literacy progress tangible across classrooms and districts.
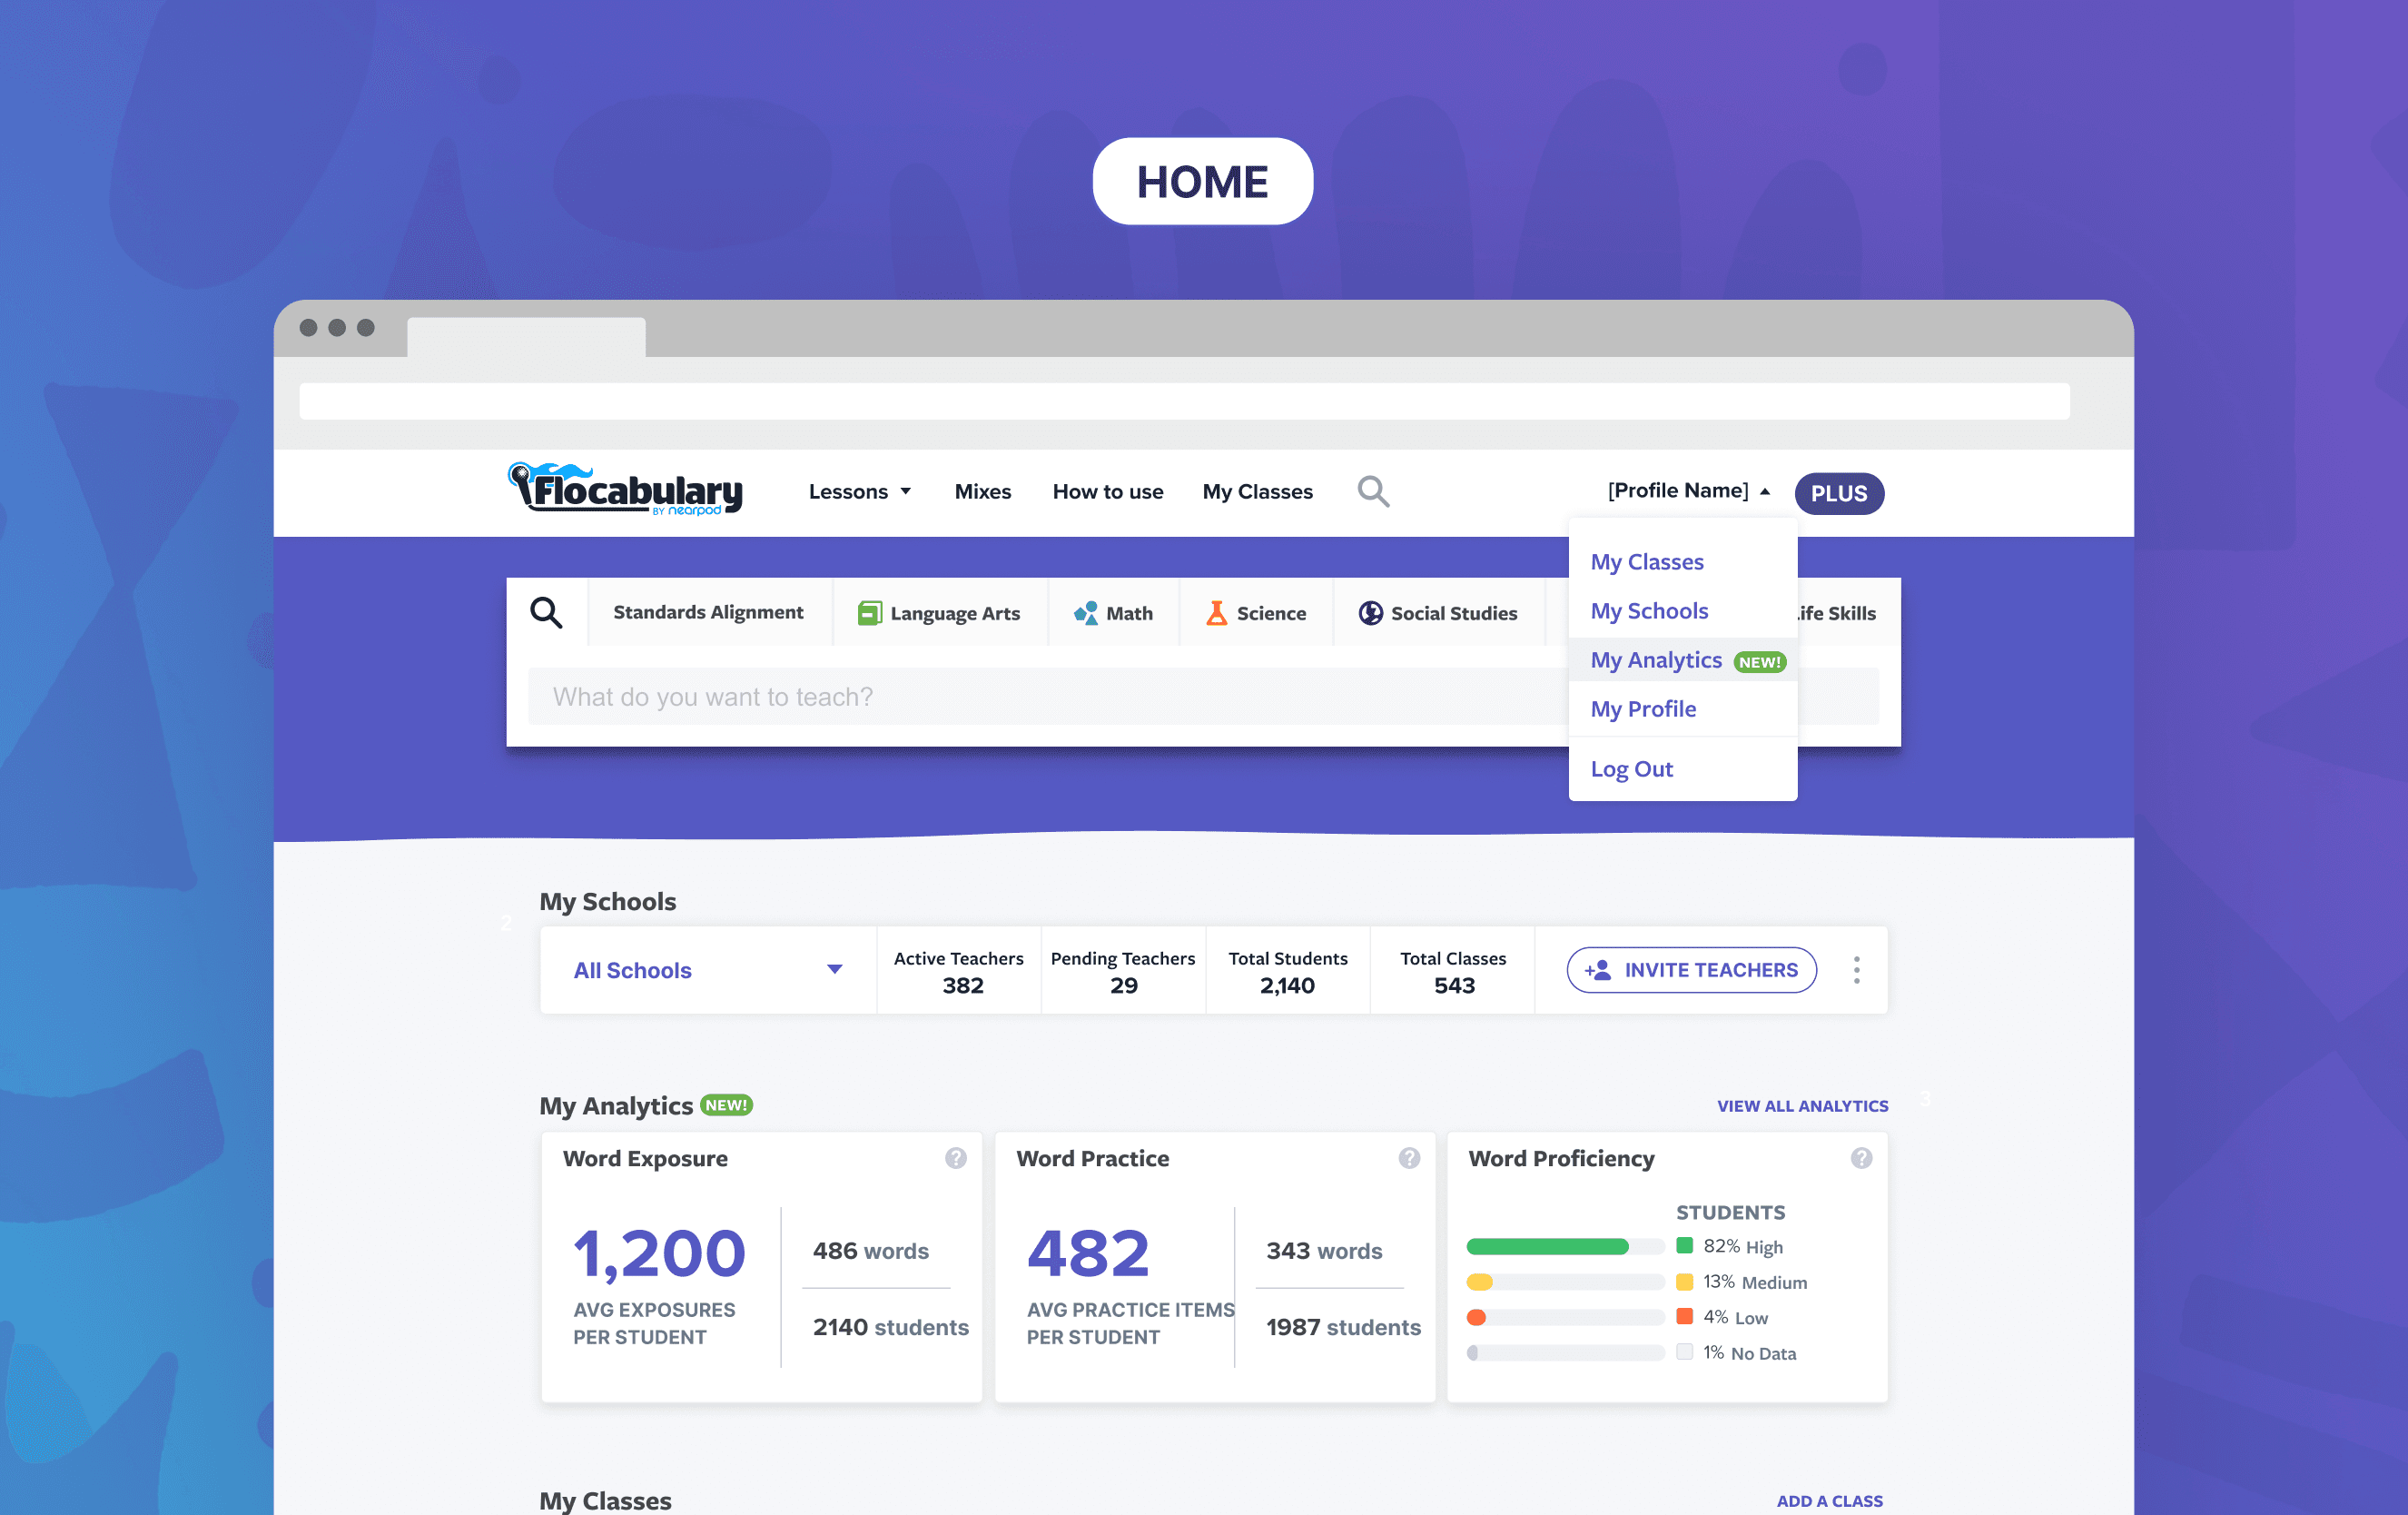
Vocabulary analytics surfaced on the home page, giving educators a quick snapshot of exposure, practice, and proficiency. 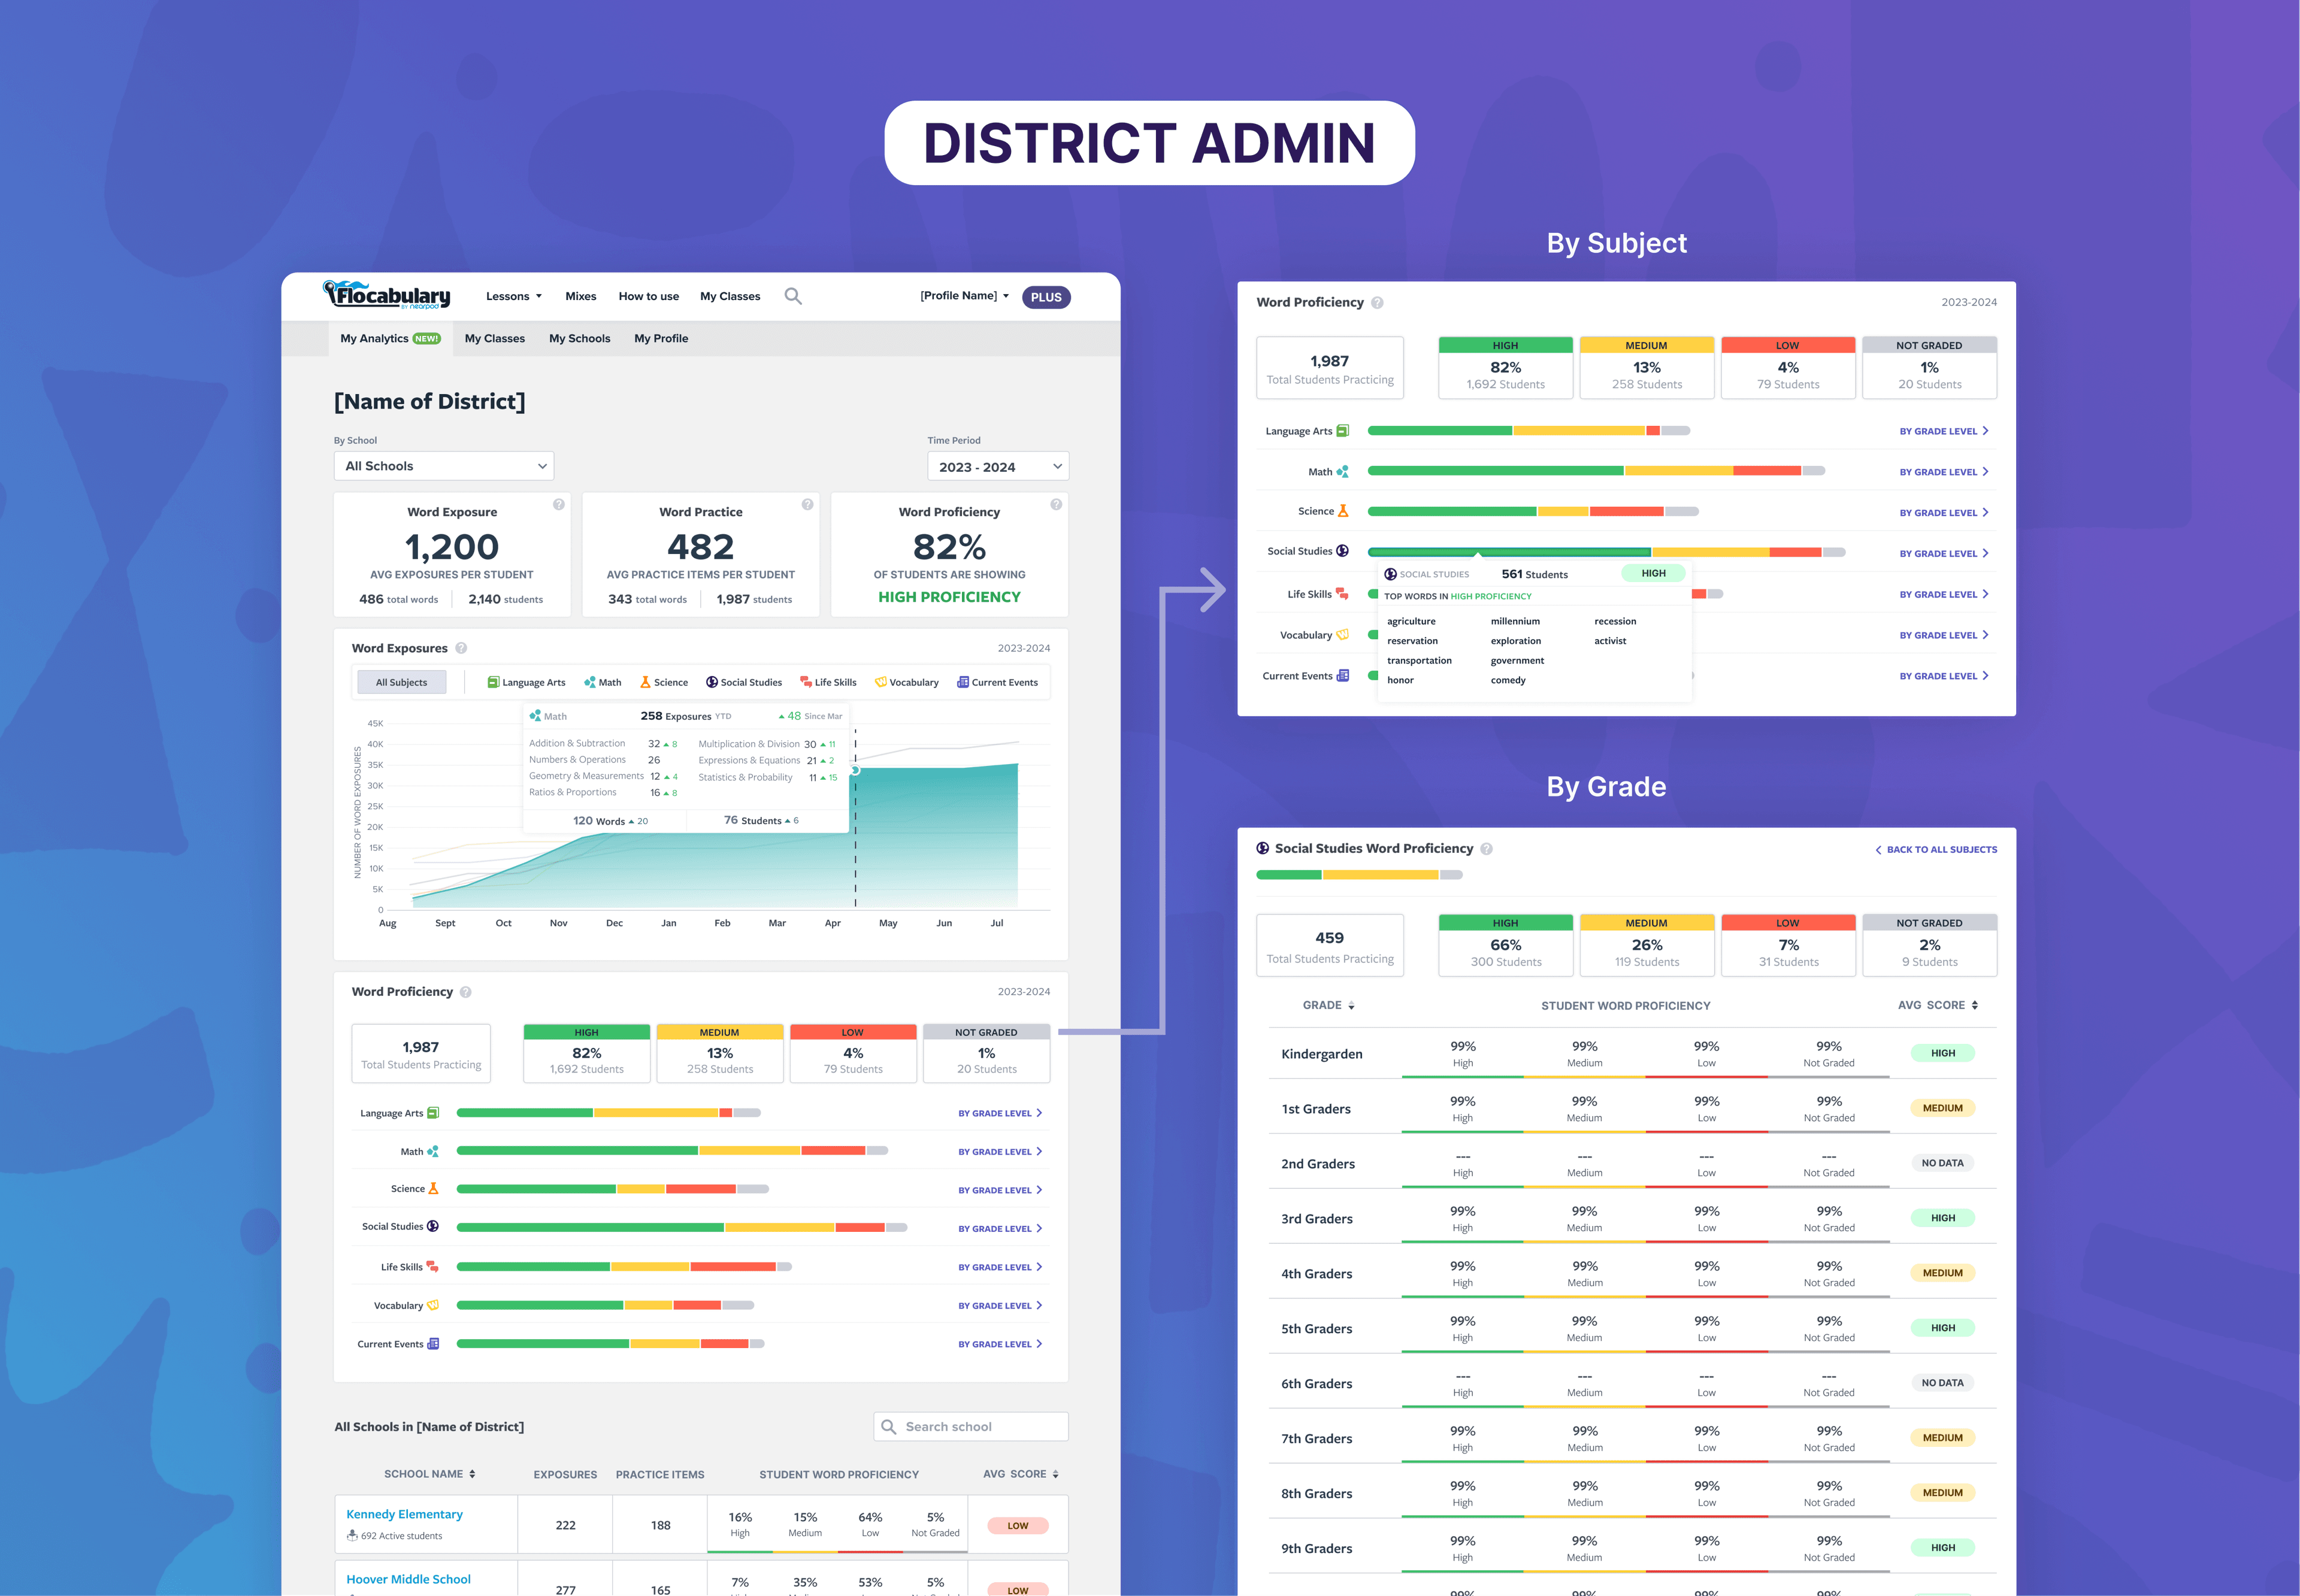
District leaders could move from overall vocabulary trends to proficiency by subject, grade, and school. 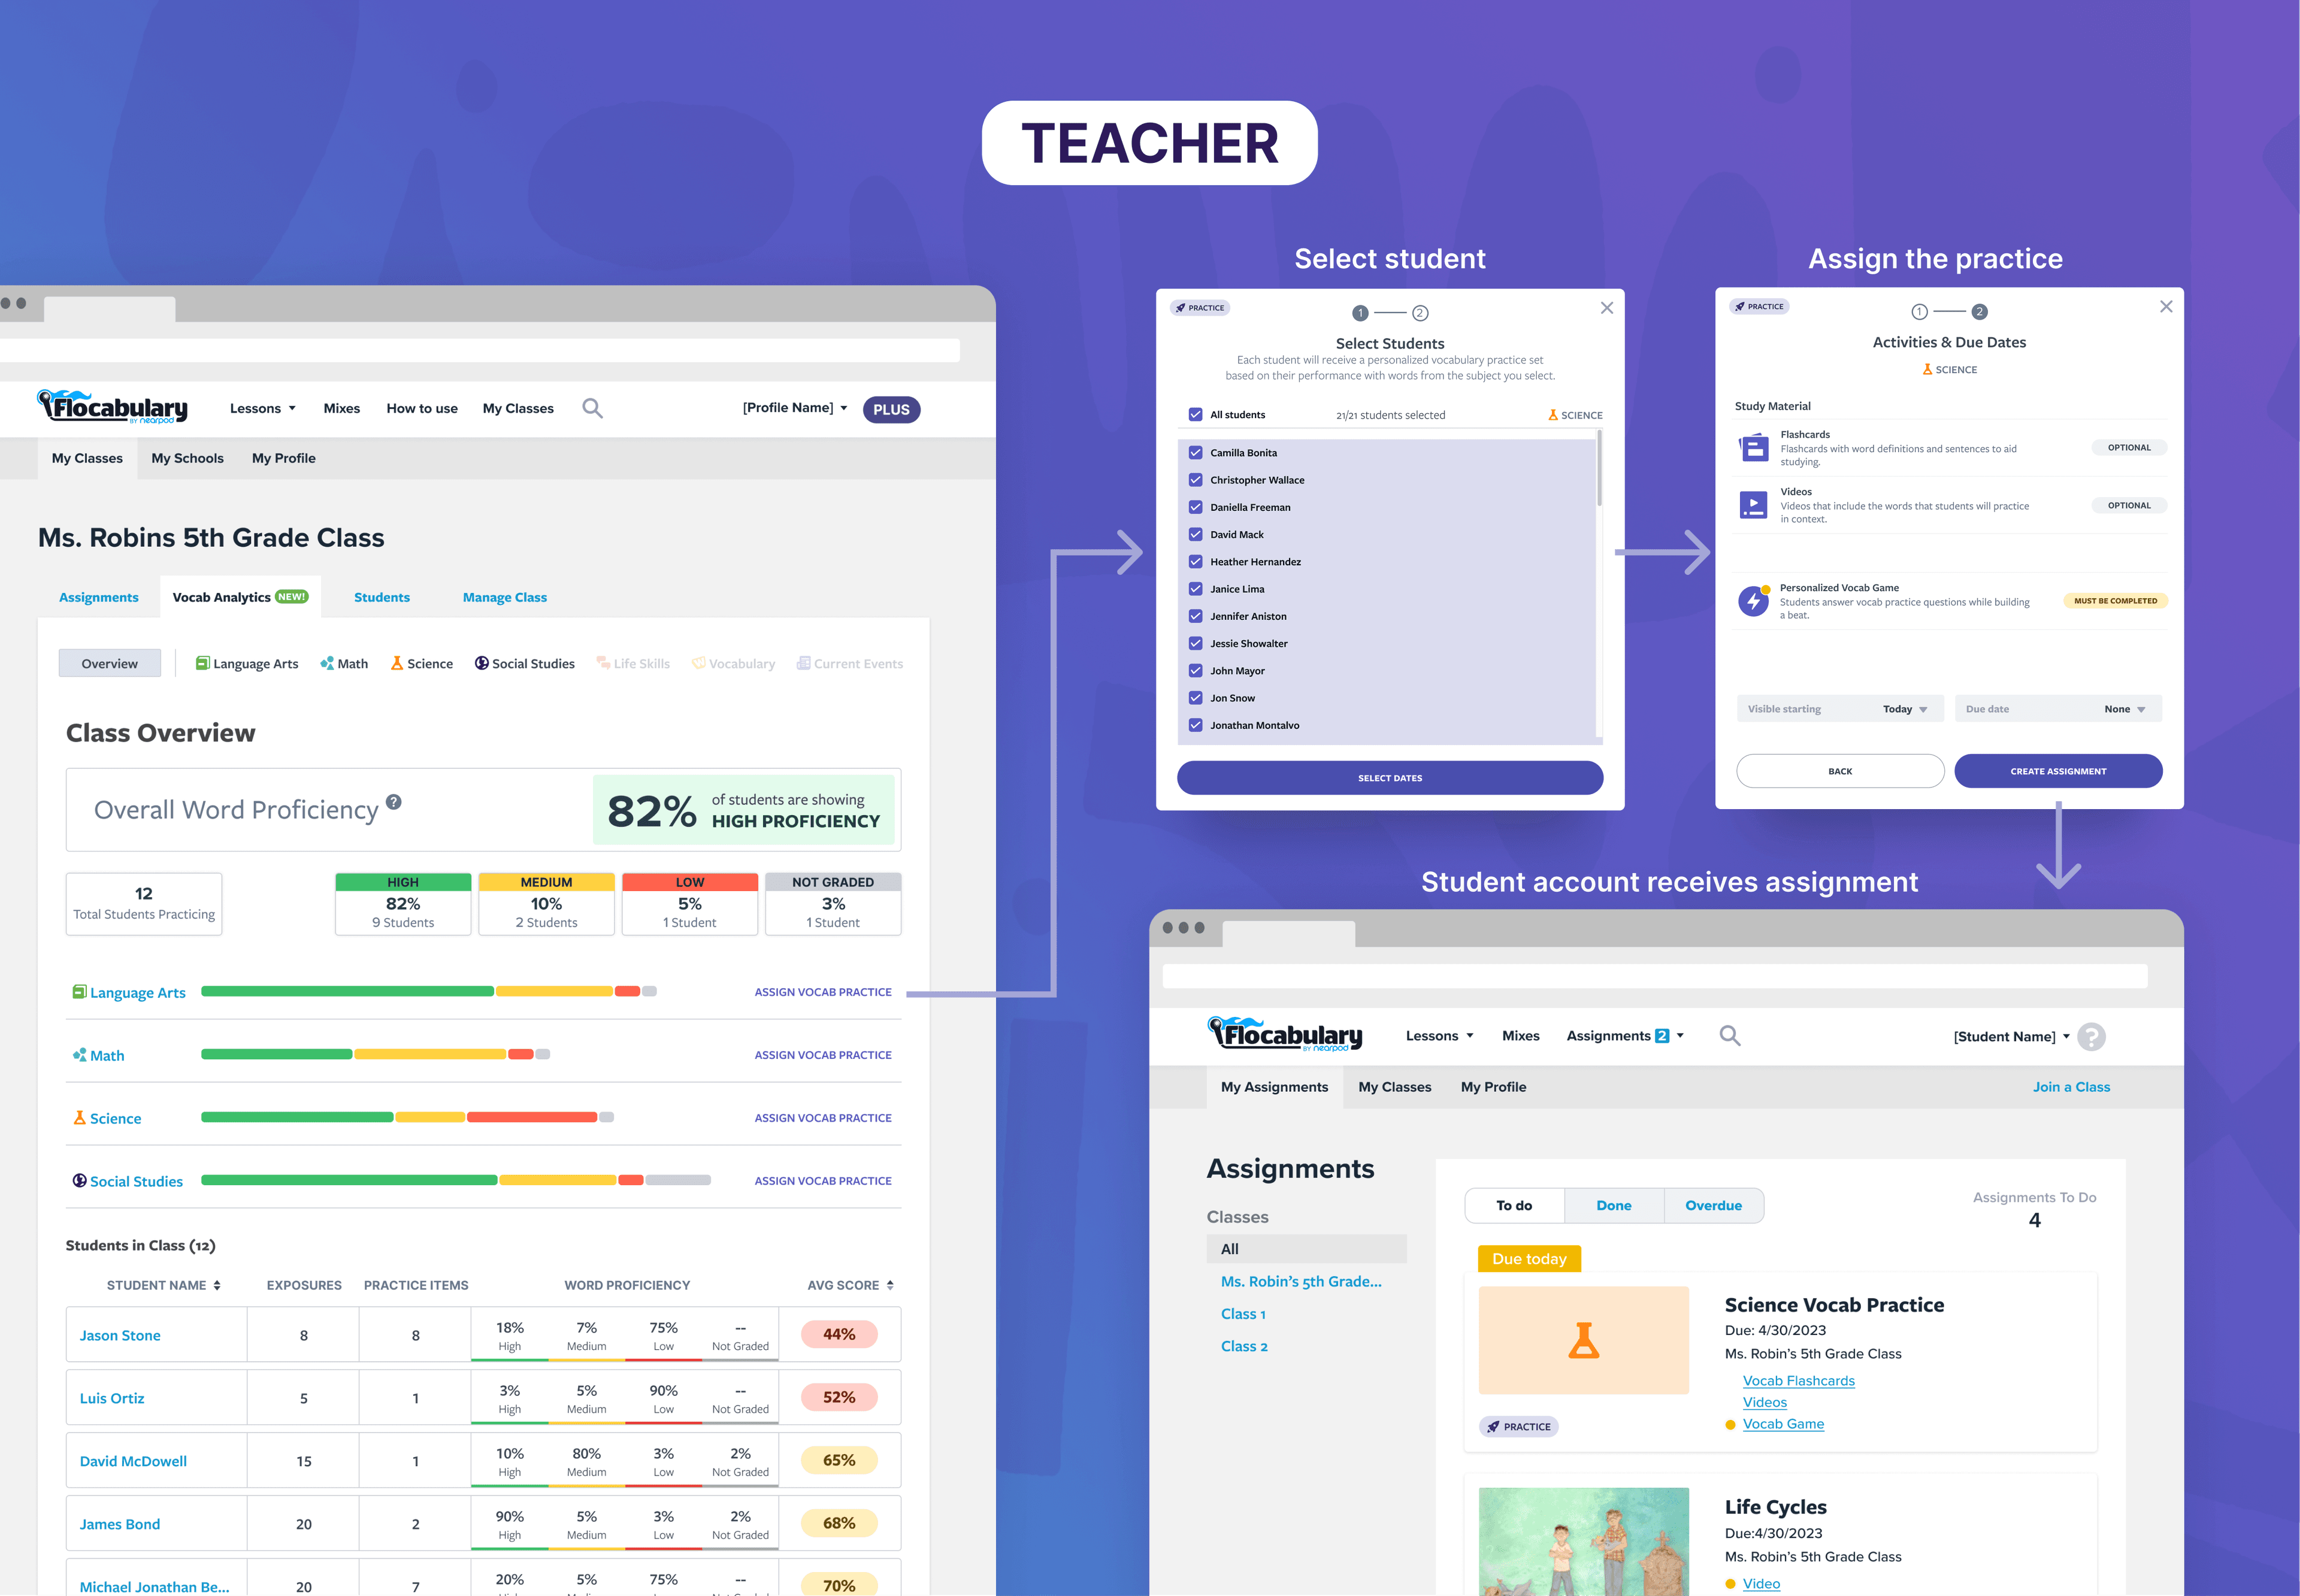
Teachers could review class proficiency and assign vocabulary practice to selected students. 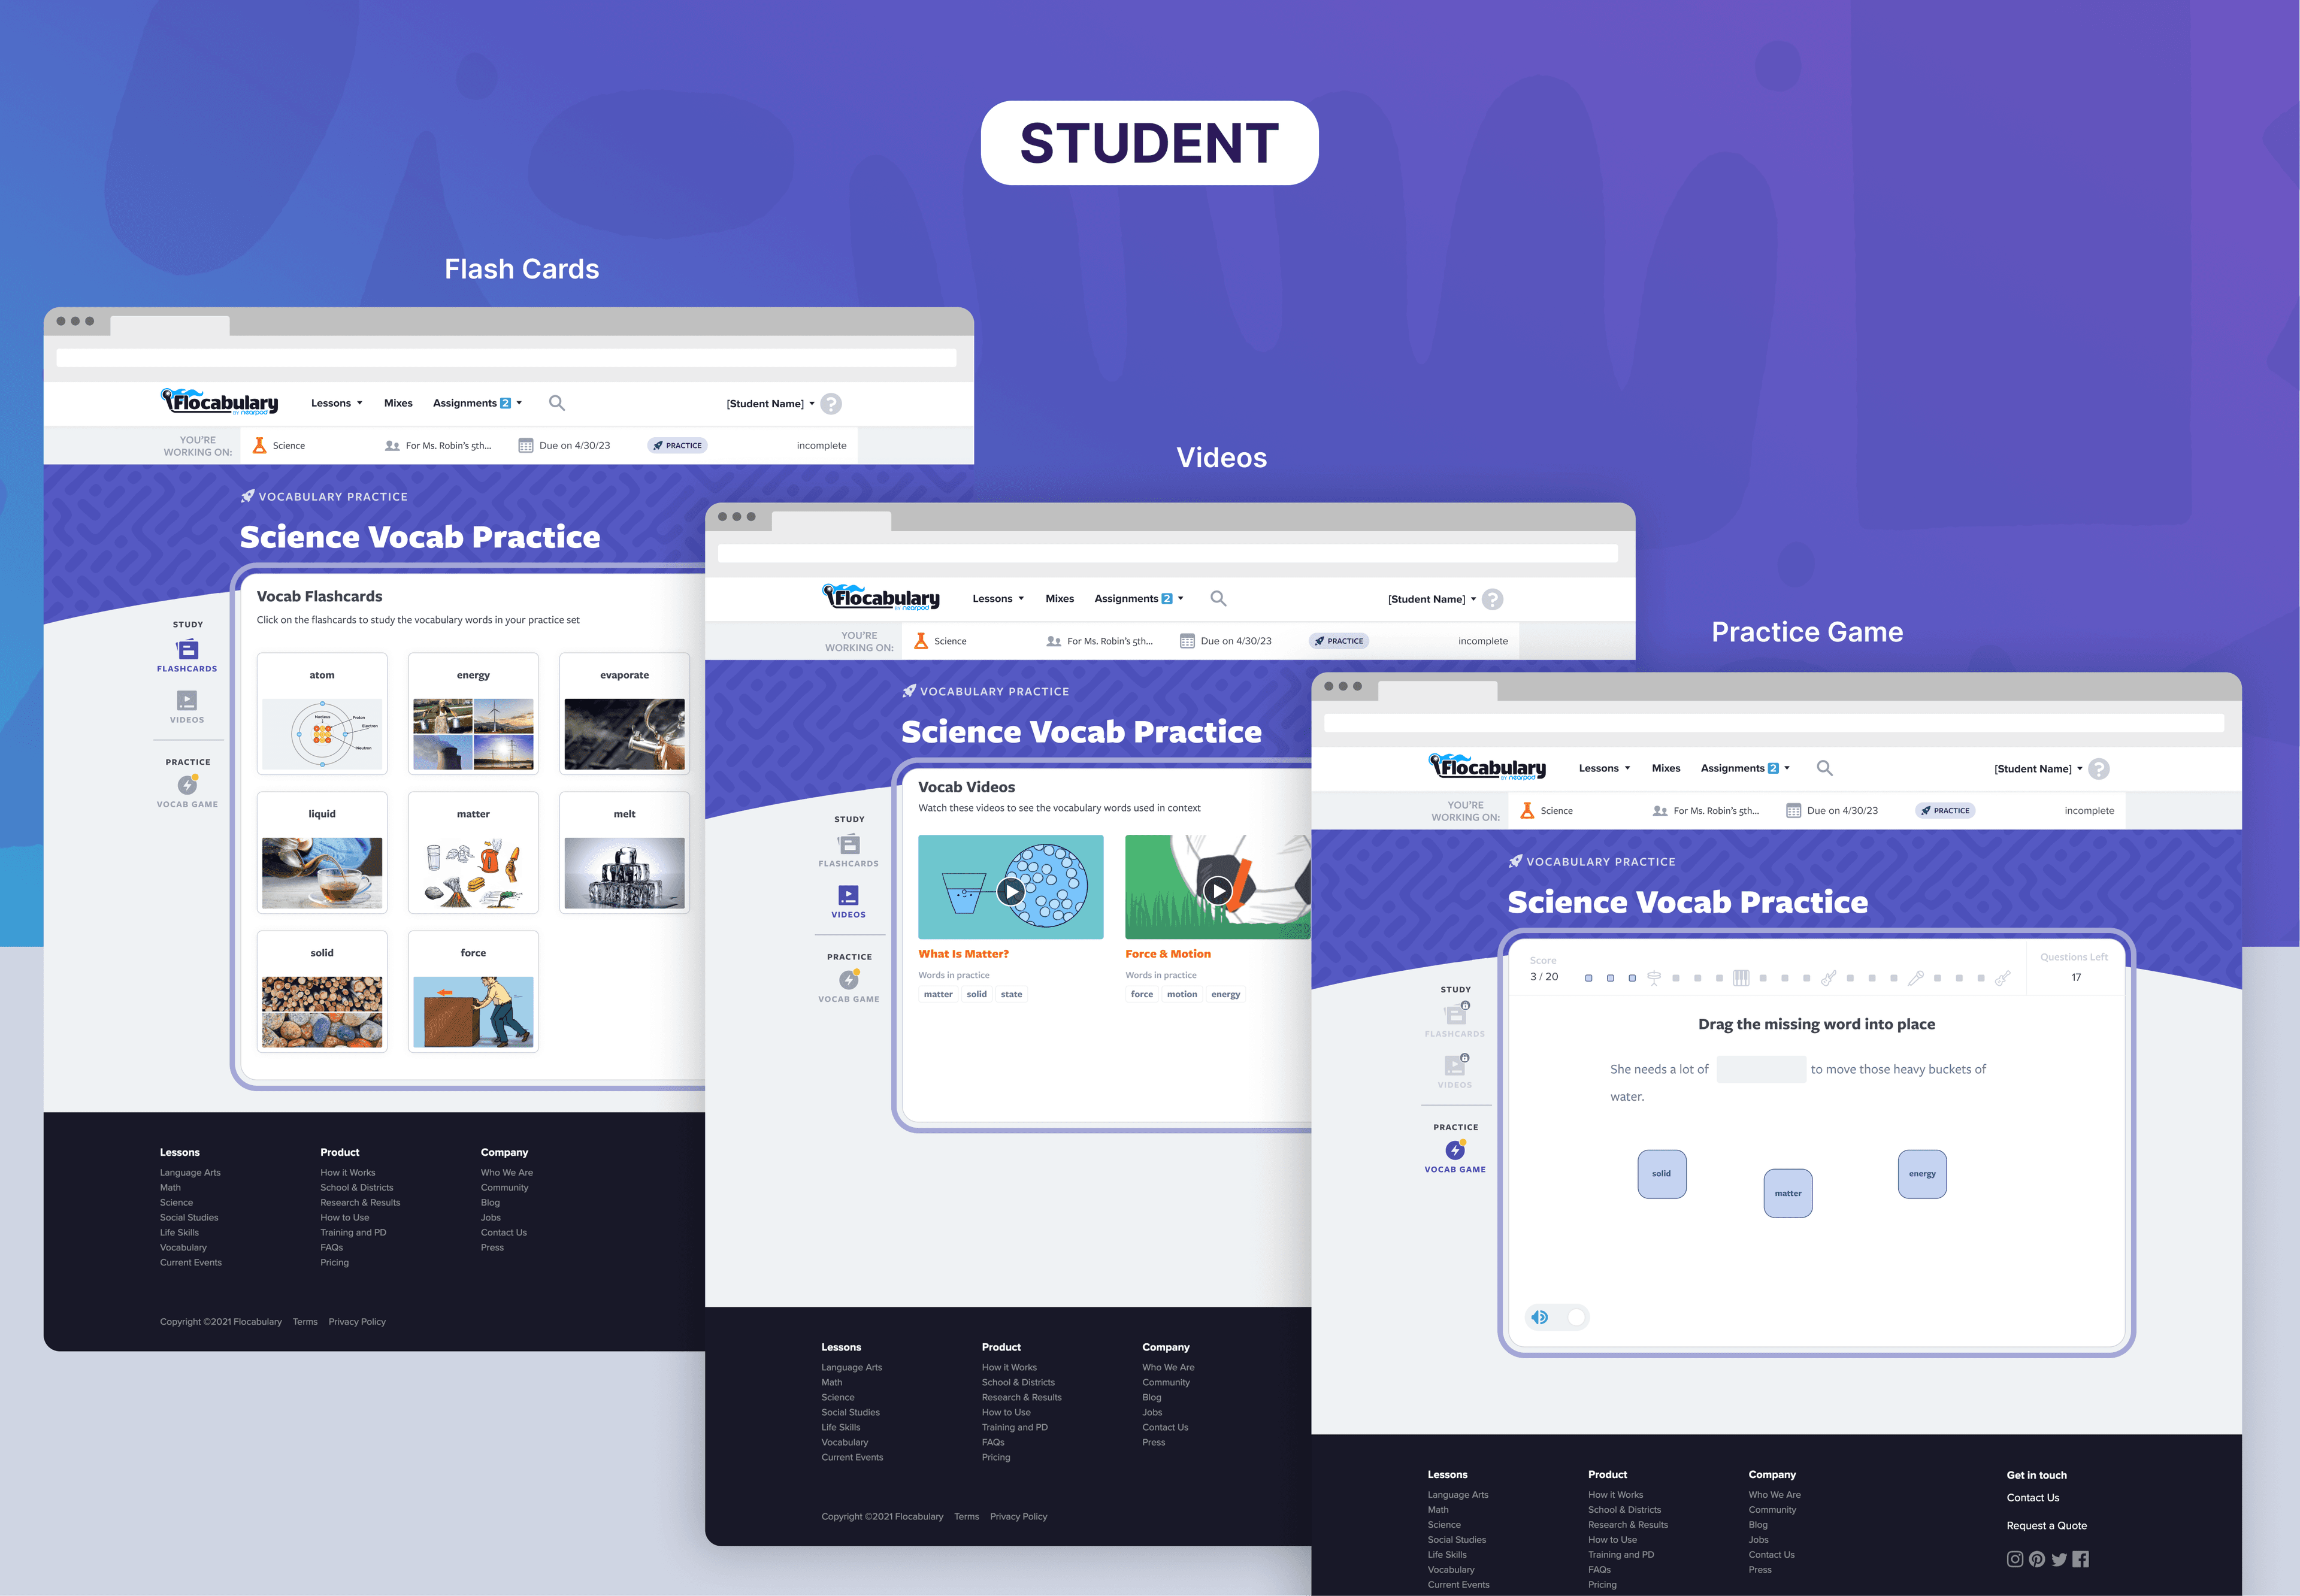
Students could study vocabulary through flashcards and videos, then apply their learnings in a practice game.
Challenge
The main challenge was translating raw vocabulary activity into meaningful growth insights without overwhelming users. Literacy development is nuanced, and incomplete datasets (e.g., schools adopting mid-year) risked skewing results.
We tested the experience with each audience. Administrators helped refine the hierarchy of district and school insights, while teachers evaluated whether proficiency levels helped them identify students who needed support and assign relevant practice. Testing with younger students called for patience and playfulness: we watched where instructions, feedback, or game interactions caused confusion and adjusted the experience around what they understood.
All of this had to fit within Flocabulary’s existing account portal. We could not restructure its navigation or page architecture, and the new views had to use established design-system variables. The work was to make a substantial new experience feel like a natural part of the product.
Outcome
The Flocabulary Vocab Dashboard gave administrators, teachers, and students the clarity they needed to see and act on vocabulary growth. For admins, it enabled informed renewal decisions and district-wide visibility into progress. For teachers, it delivered actionable insights to target classes and individuals with data-driven practice and games. For students, it turned practice into progress — transforming vocabulary acquisition into an engaging, gamified journey.
Following the rollout, the dashboard directly contributed to measurable gains across key success metrics:
- Renewals: Districts with active dashboard usage renewed at a 28% higher rate, driven by clearer proof of learning impact and improved communication of outcomes to stakeholders.
- Student literacy: Schools using the gamified practice modules saw a 19% increase in vocabulary mastery, reflecting deeper engagement and better knowledge retention.
Built with a modular and scalable architecture, the project not only elevated Flocabulary’s B2B value proposition but also laid the groundwork for Nearpod’s unified reporting ecosystem — ensuring consistency, reusability, and impact across both products.
Want the deeper walkthrough?
These case studies are intentionally concise. For a closer look at the thinking, craft, and decisions behind the work, reach out.